Only released in EOL distros:
Package Summary
Visualization of 3D environment data using mainly interactive markers.
- Author: Georg Arbeiter
- License: LGPL
- Source: git https://github.com/ipa320/cob_environment_perception.git (branch: release_electric)
Package Summary
Visualization of 3D environment data using mainly interactive markers.
- Maintainer: Georg Arbeiter <goa AT ipa.fhg DOT de>
- Author: Georg Arbeiter
- License: LGPL
- Source: git https://github.com/ipa320/cob_environment_perception.git (branch: hydro_dev)
Package Summary
The cob_3d_visualization provides two nodes for creating interactive markers.
Contents
Simple Marker Visualization API
Class to simplify usage of markers for visualizing data. Classes can be found in simple_marker.h.
Example usage:
once at startup for initialization:
cob_3d_visualization::RvizMarkerManager::get().createTopic("/marker").setFrameId("/map").clearOld();creates a MarkerArray topic on /marker with the default frame id /map
- clears old markers
to visualize markers:
cob_3d_visualization::RvizMarkerManager::get().clear();
{
        cob_3d_visualization::RvizMarker scene;
        scene.sphere(center, 0.05);
        scene.color(0.1,1.,0.1);
}

cob_3d_visualization::RvizMarkerManager::get().publish();- clears markers
- creates a sphere marker with radius 0.05 metres at point "center"
- sets color
- publish all new created markers
Nodes
shape_visualization
Both nodes in this package create interactive markers from messages of type ShapeArray. Subscribing to Shape array messages published by geometry_map node in cob_3d_mapping_geometry_map package,shape_visualization node creates markers which enable the user to interact with the geometry map by clicking on the shapes and displaying the normal vector, centroid, contour of the shape as well as deleting or moving a particular marker.The geometry map can then be modified regarding the new interactive marker positions using a service call.Subscribed Topics
/geometry_map/map_array (cob_3d_mapping_msgs/ShapeArray)- Input topic with geometric shapes.
- Feedback from interactive markers
Published Topics
/geometry_map/map/update (visualization_msgs/InteractiveMarkerUpdate) /geometry_map/map/update_full (visualization_msgs/InteractiveMarkerInit)table_visualization
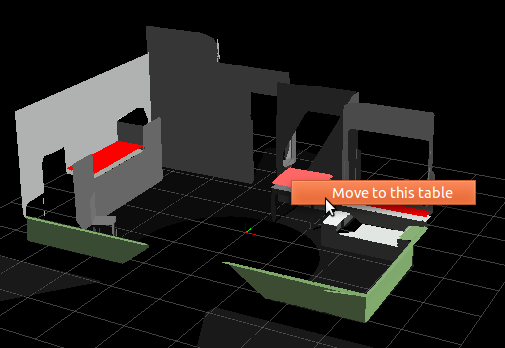
The table_visualization node creates interactive markers for tables detected by extract_tables node in cob_3d_mapping_semantics package. The user can then choose to move to a particular table. This will call the move_to_table service in cob_3d_mapping_semantics package.Subscribed Topics
/geometry_map/map_array (cob_3d_mapping_msgs/ShapeArray)- Input topic with geometric shapes.
- Feedback from interactive markers
Published Topics
/geometry_map/map/update (visualization_msgs/InteractiveMarkerUpdate) /geometry_map/map/update_full (visualization_msgs/InteractiveMarkerInit)
Usage/Examples
Start shape_visualization node
roslaunch cob_3d_visualization shape_visualization.launch
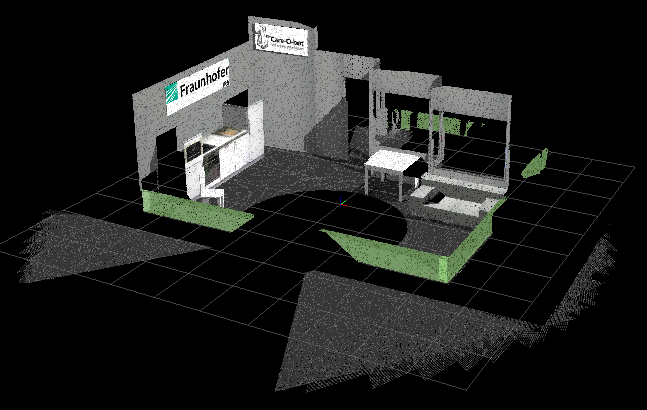
A sample point map of the environment:

The corresponding interactive markers created for the existing geometry map

Start table_visualization node
roslaunch cob_3d_visualization table_visualization.launch
Interactive Markers created for tables shown in red:


