| Note: This tutorial assumes that you have completed the previous tutorials: understanding ROS nodes. |
| |
ROS Topics 이해하기
Description: This tutorial introduces ROS topics as well as using the rostopic and rqt_plot commandline tools.Tutorial Level: BEGINNER
Next Tutorial: Understanding ROS services and parameters
Contents
Setup
roscore
roscore를 새로운 터미널에 동작시킵니다.
$ roscore
만약 roscore가 켜져있다면 아마도 아래의 에러 메세지가 출력될 것입니다.
roscore cannot run as another roscore/master is already running.
Please kill other roscore/master processes before relaunching
오직 하나의 roscore만이 동작되어야 하기 때문에 나타나는 오류입니다.
turtlesim
이번 튜토리얼에서도 역시 turtlesim을 사용합니다. 새로운 터미널에서 실행시켜 주세요.
$ rosrun turtlesim turtlesim_node
turtle keyboard teleoperation
We'll also need something to drive the turtle around with. Please run in a new terminal:
$ rosrun turtlesim turtle_teleop_key
[ INFO] 1254264546.878445000: Started node [/teleop_turtle], pid [5528], bound on [aqy], xmlrpc port [43918], tcpros port [55936], logging to [~/ros/ros/log/teleop_turtle_5528.log], using [real] time
Reading from keyboard
---------------------------
Use arrow keys to move the turtle.
키보드의 화살표 키를 통해 거북이를 움직일수 있습니다. 만약 움직일 수 없다면 turtle_teleop_key 터미널 창을 선택하여 키가 입력되는지 확인하십시오.
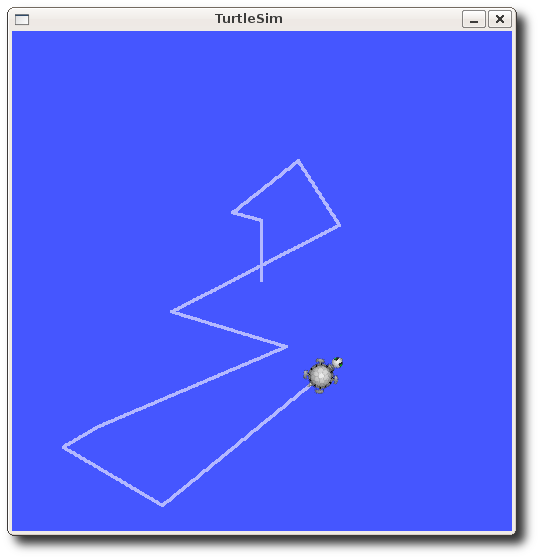
이제 당신은 거북이를 움직일 수 있습니다. 그럼 이제 어떻게 동작되는 것인지 알아봅시다.
ROS Topics
turtlesim_node 노드와 turtle_teleop_key 노드는 ROS topic을 통해 통신합니다. tutle_teleop_key는 키의 입력을 발행(publishing)하고, turtlesim은 키의 입력을 전달받기 위해 같은 topic을 구독(subscribing)합니다. 그럼 이제 rqt_graph를 이용해 node와 topic이 어떻게 동작되고 있는지 확인해 봅시다.
Note: 만약 electric이나 그 이전 버전을 사용하고 있다면, rqt는 지원되지 않습니다. 대신 rxgraph를 사용하십시오.
Using rqt_graph
rqt_graph는 ros 시스템에 어떤 일이 일어나고 있는지 동적으로 보여주는 그래프를 생성합니다. rqt_graph는 rqt 패키지의 일부입니다. 이를 설치하지 않은 경우에는 아래의 명령어를 실행시키세요.
$ sudo apt-get install ros-<distro>-rqt
$ sudo apt-get install ros-<distro>-rqt-common-plugins
<distro>를 당신의 ROS distribution으로 변경해주세요. 예) indigo, jade, kinetic, lunar
새로운 터미널에서 아래의 명령어를 실행하세요:
$ rosrun rqt_graph rqt_graph
아래와 비슷한 그림이 출력됩니다.

만약 마우스를 /turtle1/command_velocity에 가져다대면 해당 node와 topic이 강조됩니다. 보시다시피, turtlesim_node와 turtle_teleop_key 노드는 /turtle1/command_velocity라는 이름의 topic을 통해 통신하고있습니다.

Introducing rostopic
rostopic 명령어를 통해 topics에 대한 많은 정보를 얻을수 있습니다.
그리고, help 옵션 이용해 rostopic의 sub-command를 알아볼수 있습니다.
$ rostopic -h
rostopic bw     display bandwidth used by topic
rostopic echo   print messages to screen
rostopic hz     display publishing rate of topic
rostopic list   print information about active topics
rostopic pub    publish data to topic
rostopic type   print topic type
다른 방법으로 rostopic을 입력한 뒤 tab 키를 눌러 가능한 sub-commands를 확인할 수 있습니다.
$ rostopic
bw    echo  find  hz    info  list  pub   type
그렇다면 이 sub-commands를 이용해 turtlesim을 들여다 봅시다.
Using rostopic echo
rostopic echo는 topic이 발행하는 데이터를 보여줍니다.
Usage:
rostopic echo [topic]
turtle_teleop_key 노드에서 발행된 velocity data를 확인하기 바랍니다.
ROS Hydro 이상의 버전에 대해서는, /turtle1/cmd_vel에 의해 데이터들이 발행됩다다. 새로운 터미널에서 아래의 명령어를 실행하세요.
$ rostopic echo /turtle1/cmd_vel
ROS Grooby 이전 버전에 대해서는, /turtle1/command_velocity topic에 의해 데이터들이 발행됩니다. 새로운 터미널에서 아래의 명령어를 실행하세요.
$ rostopic echo /turtle1/command_velocity
하지만, 해당 topic에서 아무 데이터도 발행하고 있지 않기 때문에 아무 것도 확인할 수 없을 것 입니다. 화살표 키보드를 눌러 turtle_teleop_key node가 데이터를 발행하도록 합시다. 만약 거북이가 움직이지 않는다면 turtle_teleop_key 터미널을 다시 한번 클릭하기 바랍니다.
ROS Hydro 이상의 버전에서는, up키를 눌렀을 때 다음과 같은 출력을 확인할 수 있습니다.
linear:
  x: 2.0
  y: 0.0
  z: 0.0
angular:
  x: 0.0
  y: 0.0
  z: 0.0
---
linear:
  x: 2.0
  y: 0.0
  z: 0.0
angular:
  x: 0.0
  y: 0.0
  z: 0.0
---
ROS Groovy 이전의 버전에서는, up 키를 눌렀을 때 다음과 같은 출력을 확인할 수 있습니다.
---
linear: 2.0
angular: 0.0
---
linear: 2.0
angular: 0.0
---
linear: 2.0
angular: 0.0
---
linear: 2.0
angular: 0.0
---
linear: 2.0
angular: 0.0
다시 한번 rqt_graph를 확인해 봅시다. 좌상단에 있는 새로고침 버튼을 눌러 새 노드를 확인합시다. 여기서 붉게 표시된 rostopic echo 역시 turtle1/command_velocity topic을 구독하고 있는 것을 확인 할 수 있습니다.

Using rostopic list
rostopic list는 현재 구독 혹은 발행되고 있는 모든 topic의 목록을 반환합니다.
이번에는 list sub-comand의 전달인자에 대해 알아봅시다. 새 터미널에서 아래의 명령어를 실행하세요.
$ rostopic list -h
Usage: rostopic list [/topic]

Options:
  -h, --help            show this help message and exit
  -b BAGFILE, --bag=BAGFILE
                        list topics in .bag file
  -v, --verbose         list full details about each topic
  -p                    list only publishers
  -s                    list only subscribers
rostopic list 명령어는 verbose 옵션을 사용 할 수 있습니다.
$ rostopic list -v
topic이 어디에 발행되는지 어디서 구독되는지 그리고 topic의 type을 볼 수 있습니다.
ROS Hydro 이후 버전,
Published topics:
 * /turtle1/color_sensor [turtlesim/Color] 1 publisher
 * /turtle1/cmd_vel [geometry_msgs/Twist] 1 publisher
 * /rosout [rosgraph_msgs/Log] 2 publishers
 * /rosout_agg [rosgraph_msgs/Log] 1 publisher
 * /turtle1/pose [turtlesim/Pose] 1 publisher

Subscribed topics:
 * /turtle1/cmd_vel [geometry_msgs/Twist] 1 subscriber
 * /rosout [rosgraph_msgs/Log] 1 subscriber
ROS Groovy 이전 버전,
Published topics:
 * /turtle1/color_sensor [turtlesim/Color] 1 publisher
 * /turtle1/command_velocity [turtlesim/Velocity] 1 publisher
 * /rosout [roslib/Log] 2 publishers
 * /rosout_agg [roslib/Log] 1 publisher
 * /turtle1/pose [turtlesim/Pose] 1 publisher

Subscribed topics:
 * /turtle1/command_velocity [turtlesim/Velocity] 1 subscriber
 * /rosout [roslib/Log] 1 subscriber
ROS Messages
topic을 통한 통신은 노드 간에 ROS message를 전송으로 성사된다. 발행자와 구독자간에 통신을 위해서는, 구독자(turtle_teleop_key)와 발행자(turtlesim_node)는 같은 type의 message를 주고 받아야한다. 이것의 의미는 topic의 type은 발행되는 message의 type에 의해 결정된다는 것이다. topic에서 전송된 message의 타입은 rostopic type을 통해 판별할 수 있다.
Using rostopic type
rostopic type은 발행되고 있는 어떠한 topic의 message type을 반환한다.
Usage:
rostopic type [topic]
ROS Hydro 이상의 버전,
- Try:
$ rostopic type /turtle1/cmd_vel
- You should get:
geometry_msgs/Twist
We can look at the details of the message using rosmsg:
$ rosmsg show geometry_msgs/Twist
geometry_msgs/Vector3 linear
  float64 x
  float64 y
  float64 z
geometry_msgs/Vector3 angular
  float64 x
  float64 y
  float64 z
- You should get:
For ROS Groovy and earlier,
- Try:
$ rostopic type /turtle1/command_velocity
- You should get:
turtlesim/Velocity
rosmsg를 이용해 message의 자세한 사항을 볼 수 있습니다.
$ rosmsg show turtlesim/Velocity
float32 linear
float32 angular
- You should get:
이제 우리는 turtlesim이 어떠한 type의 message를 기대하고 있는지 알았으므로 거북이에게 명령을 발행할 수 있습니다.
rostopic continued
우리는 ROS message에 대해 알아 보았습니다. 그렇다면 이번에는 rostopic을 message와 함께 사용해 봅시다.
Using rostopic pub
rostopic pub은 광고된(advertised) topic에 데이터를 발행합니다.
Usage:
rostopic pub [topic] [msg_type] [args]
For ROS Hydro and later, example:
$ rostopic pub -1 /turtle1/cmd_vel geometry_msgs/Twist -- '[2.0, 0.0, 0.0]' '[0.0, 0.0, 1.8]'
For ROS Groovy and earlier, example:
$ rostopic pub -1 /turtle1/command_velocity turtlesim/Velocity -- 2.0 1.8
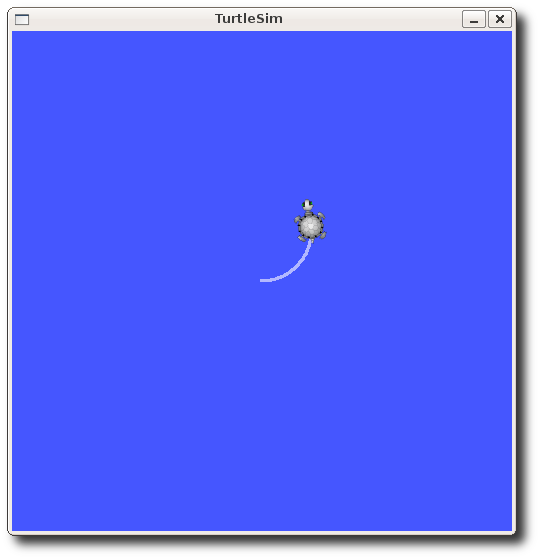
The previous command will send a single message to turtlesim telling it to move with a linear velocity of 2.0, and an angular velocity of 1.8 .
This is a pretty complicated example, so lets look at each argument in detail.
For ROS Hydro and later,
This command will publish messages to a given topic:
rostopic pub
This option (dash-one) causes rostopic to only publish one message then exit:
-1
This is the name of the topic to publish to:
/turtle1/cmd_vel
This is the message type to use when publishing to the topic:
geometry_msgs/Twist
This option (double-dash) tells the option parser that none of the following arguments is an option. This is required in cases where your arguments have a leading dash -, like negative numbers.
--
As noted before, a geometry_msgs/Twist msg has two vectors of three floating point elements each: linear and angular. In this case, '[2.0, 0.0, 0.0]' becomes the linear value with x=2.0, y=0.0, and z=0.0, and '[0.0, 0.0, 1.8]' is the angular value with x=0.0, y=0.0, and z=1.8. These arguments are actually in YAML syntax, which is described more in the YAML command line documentation.
'[2.0, 0.0, 0.0]' '[0.0, 0.0, 1.8]'
For ROS Groovy and earlier,
This command will publish messages to a given topic:
rostopic pub
This option (dash-one) causes rostopic to only publish one message then exit:
-1
This is the name of the topic to publish to:
/turtle1/command_velocity
This is the message type to use when publishing to the topic:
turtlesim/Velocity
This option (double-dash) tells the option parser that none of the following arguments is an option. This is required in cases where your arguments have a leading dash -, like negative numbers.
--
As noted before, a turtlesim/Velocity msg has two floating point elements : linear and angular. In this case, 2.0 becomes the linear value, and 1.8 is the angular value. These arguments are actually in YAML syntax, which is described more in the YAML command line documentation.
2.0 1.8
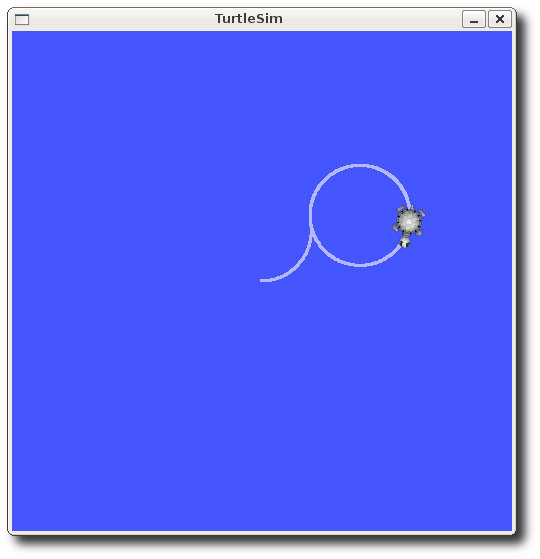
You may have noticed that the turtle has stopped moving; this is because the turtle requires a steady stream of commands at 1 Hz to keep moving. We can publish a steady stream of commands using rostopic pub -r command:
For ROS Hydro and later,
$ rostopic pub /turtle1/cmd_vel geometry_msgs/Twist -r 1 -- '[2.0, 0.0, 0.0]' '[0.0, 0.0, -1.8]'
For ROS Groovy and earlier,
$ rostopic pub /turtle1/command_velocity turtlesim/Velocity -r 1 -- 2.0 -1.8
This publishes the velocity commands at a rate of 1 Hz on the velocity topic.
rqt_graph를 사용해 어떤 일이 일어나고 있는지 확인해 봅시다. 좌상단의 새로고침 버튼을 눌러주세요. 빨간색의 rostopic pub node는 초록색의 rostopic echo node와 통신하고 있습니다.

계속해서 원을 그리고 있는 거북이를 확인할 수 있습니다. 새로운 터미널에서, rostopic echo를 사용해 turtlesim에 발행되고 있는 데이터를 확인해보세요.
rostopic echo /turtle1/pose
Using rostopic hz
rostopic hz는 데이터가 발행되는 속도를 보고합니다.
Usage:
rostopic hz [topic]
Let's see how fast the turtlesim_node is publishing /turtle1/pose:
$ rostopic hz /turtle1/pose
You will see:
subscribed to [/turtle1/pose]
average rate: 59.354
        min: 0.005s max: 0.027s std dev: 0.00284s window: 58
average rate: 59.459
        min: 0.005s max: 0.027s std dev: 0.00271s window: 118
average rate: 59.539
        min: 0.004s max: 0.030s std dev: 0.00339s window: 177
average rate: 59.492
        min: 0.004s max: 0.030s std dev: 0.00380s window: 237
average rate: 59.463
        min: 0.004s max: 0.030s std dev: 0.00380s window: 290
turtlesim은 거북이에게 약 60Hz의 속도 데이터를 발행하고 있음을 알수 있습니다. 또한, rostopic type과 함께 rosmsg show를 사용하여 topic에 대한 자세한 정보를 얻을 수 있습니다.
For ROS Hydro and later,
$ rostopic type /turtle1/cmd_vel | rosmsg show
For ROS Groovy and earlier,
$ rostopic type /turtle1/command_velocity | rosmsg show
Now that we've examined the topics using rostopic let's use another tool to look at the data published by our turtlesim:
Using rqt_plot
Note: If you're using electric or earlier, rqt is not available. Use rxplot instead.
rqt_plot은 topic에서 발행되는 데이터를 시간에 따른 흐르는 그래프로 보여줍니다. /turtle1/pose topic에서 발행되고 있는 데이터를 rqt_plot을 사용해 출력해 봅시다. 먼저 아래의 명령어를 새로운 터미널에서 사용해 보세요.
$ rosrun rqt_plot rqt_plot
새로운 창이 떠오를 것입니다. 좌상단에 있는 text box에서 새로운 topic을 그래프에 추가할 수 있습니다. /turtle1/pose/x를 입력하면 더하기 버튼이 강조됩니다. 버튼을 누르고 같은 작업을 반복하여 /turtle1/pose/y를 추가합니다. 그렇다면 거북이의 x-y 위치가 그래프에 출력 될 것입니다.
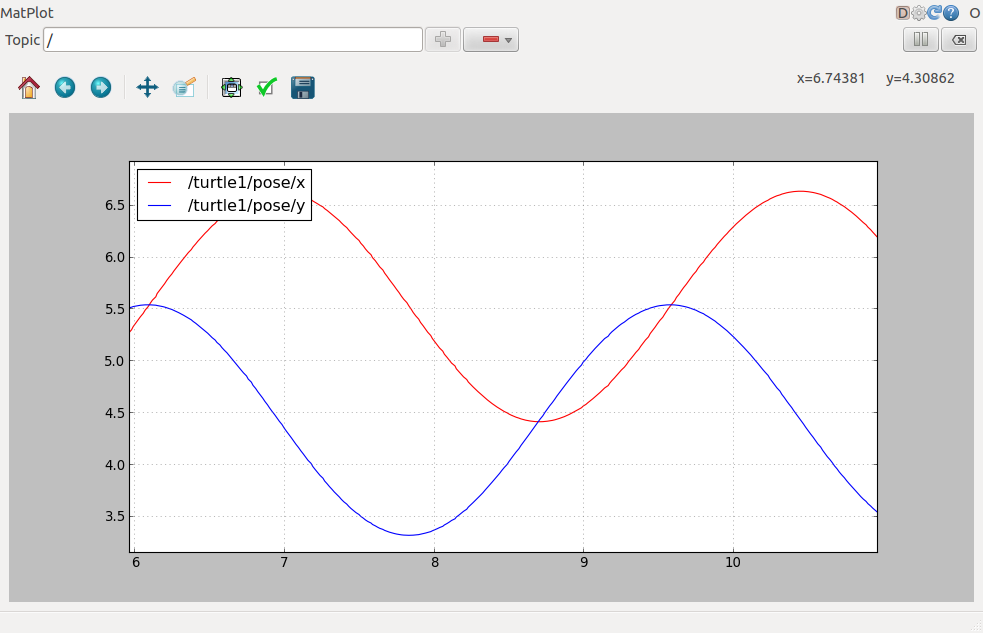
빼기 버튼을 누르면 그래프에서 뺄 토픽에 대한 메뉴가 나타납니다. 방금 추가한 두 토픽을 감추고, /turtle1/pose/theta를 추가하면 아래의 그래프를 확인 할 수 있습니다.
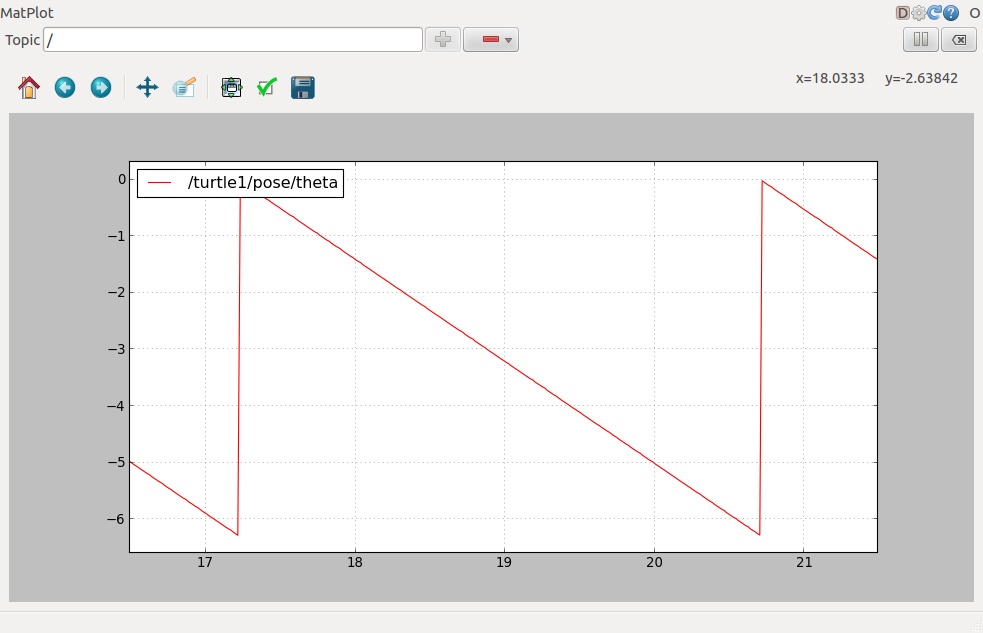
이걸로 끝입니다. Ctrl-C를 눌러 rostopic 터미널을 죽이세요. but, turtlesim은 유지해주세요.
이제 당신은 ROS topic이 어떻게 동작하는지 이해했습니다. 이제 service와 parameter가 어떻게 동작하는지 알아봅시다. services and parameters work.
Video Tutorial
The following video presents a small tutorial using turtlesim on ROS nodes and ROS topics


