| |
Using mtrace_plot
Description: Using mtrace_plot to view MotorTrace messagesKeywords: MotorTrace mtrace mtrace_plot
Tutorial Level: INTERMEDIATE
Contents
Introduction
mtrace_plot is a GUI tool that will generate plots from MotorTrace messages. mtrace_plot can be useful for diagnosing certain motor or motor driver problems.
Run mtrace_plot
If mtrace_tools was checked-out as part of an overlay, make sure it is first compiled.
rosmake mtrace_tools
Now run mtrace_plot
rosrun mtrace_tools mtrace_plot.py
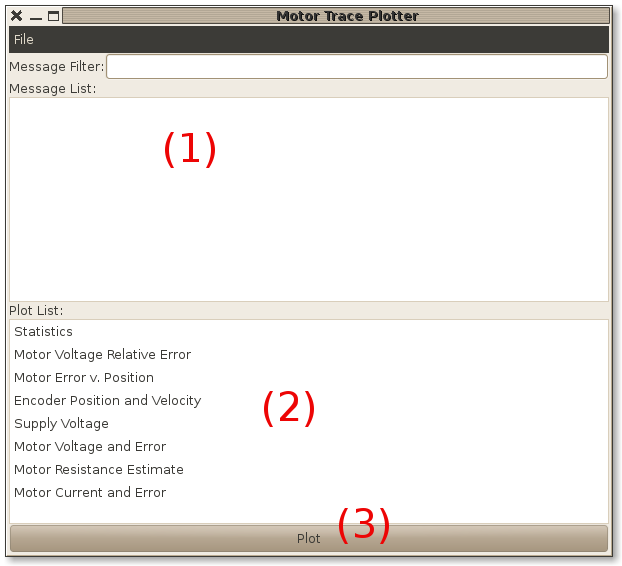
You should see GUI like the one below:
Message Listing (1)
The top list box (1) provides a list of messages that have been loaded or received. Mesages can be both loaded from a file, or received on a ROS topic.
Plot Listing (2)
The bottom list box (2) provides a list of predefined plots that can displayed.
Plot button (3)
The plot button at the very bottom will generate the all the selected plots for all the selected messages.
Loading MotorTrace message from bagfile
Download motor_trace_examples_1.bag, a bagfile with containing MotorTrace messages. Then use menu item File -> Open Bag File, to load the bag file.
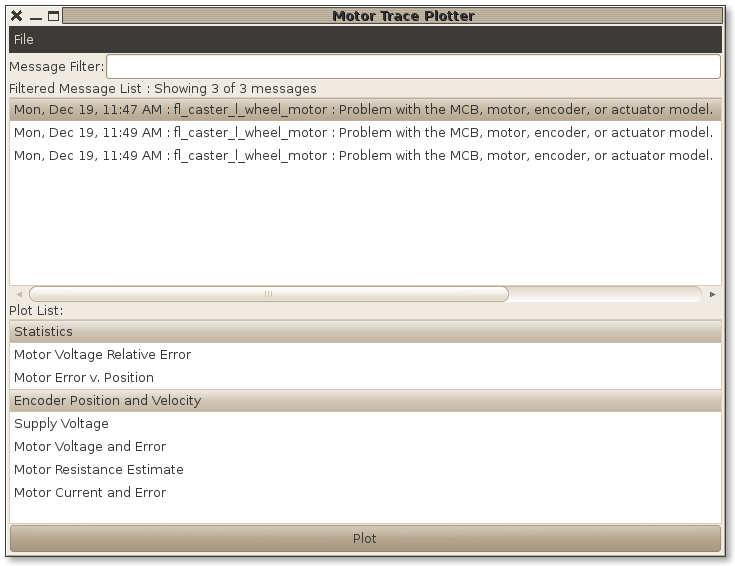
You should see the following 3 MotorTrace messages loaded in the GUI:
Generating plots
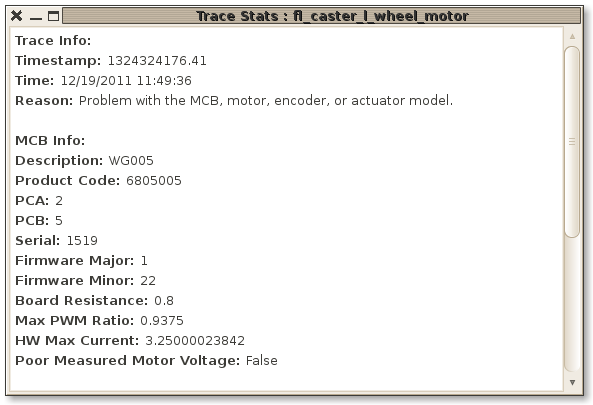
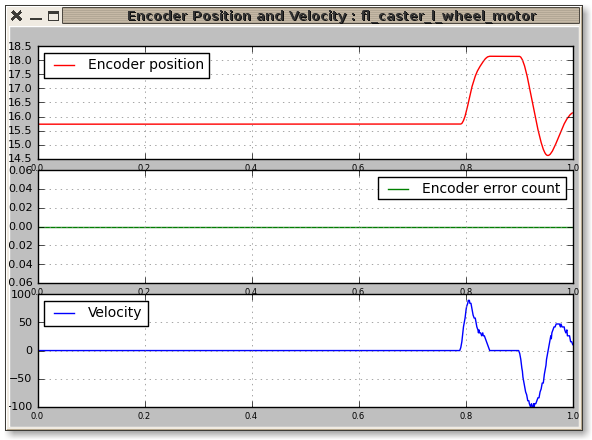
Select the first two messages in the Messages List, also select the Statistics and Encoder Position and Velocity items from from the list of plot types. Hold down the Ctrl key when clicking on items to select multiple list items at once. Finally, click plot. Four plot windows should now be created.
Receiving MotorTrace messages from a ROS topic
As mentioned before, MotorTrace messages can be both loaded from a bag file or recieved on ROS topic. By default, mtrace_plot will subscribe to any ROS topic with the MotorTrace message type.
Generating MotorTrace messages on ROS topic
Using a PR2
With a running PR2, mtrace_plot could receive messages generated by produced by pr2_etherCAT (realtime_loop) in response to certain events. One easy way to generate a lot of Runstop Events would be to press PR2 RunStop button while PR2 is running. Each motor should produce a new MotorTrace message.
Playing a recorded bag file
Since not everybody has a PR2 available, we will play messages from a pre-recorded bag file. The bag file was recorded from PR2 when runstop was pressed.
For next step, start a ROS core in a new terminal (if was not already running).
roscore
Run mtrace_plot.py GUI with command line option to automatically start listening to ROS for MotorTrace messages.
rosrun mtrace_tools mtrace_plot.py
Download motor_trace_examples_1.bag, and re-play messages in bag file with rosbag.
rosbag play -d3 /path/to/bag_file/mtor_trace_examples_1.bag
The mtrace_plot GUI receive the same 3 MotorTrace messages as before. However, since they messages are being replayed in realtime it will take about 30 seconds to get receive all the messages.
The -d3 option with ROS bag allow delays enough time for mtrace_plot to subscribe the new topics being published.
Motor Halted
MotorTraces are often published when the PR2 motors halt because of some type of error. All MotorTrace topics are latched which means that a new subscriber will always most recently published message instead of needing to wait for a new message to be published. This allows mtrace_plot to be run after a motor halt occurs and still retrieve the MotorTrace message generated by the motor halt.
Note: Not all motor halts will generate MotorTrace messages for all motors.


