!
| Note: This tutorial assumes that you have completed the previous tutorials: RGB-D Hand-Held Mapping With a Kinect. |
| |
Wifi Signal Strength Mapping (User Data Usage)
Description: This tutorial shows how to add user data during mapping that will be saved directly in RTAB-Map's database for convenience.Tutorial Level: INTERMEDIATE
Contents
Introduction
Version >0.11.14 required.
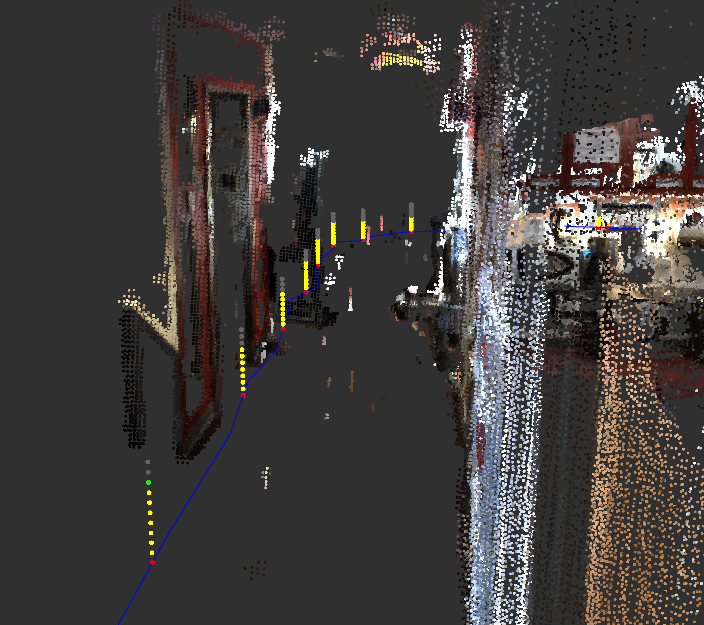
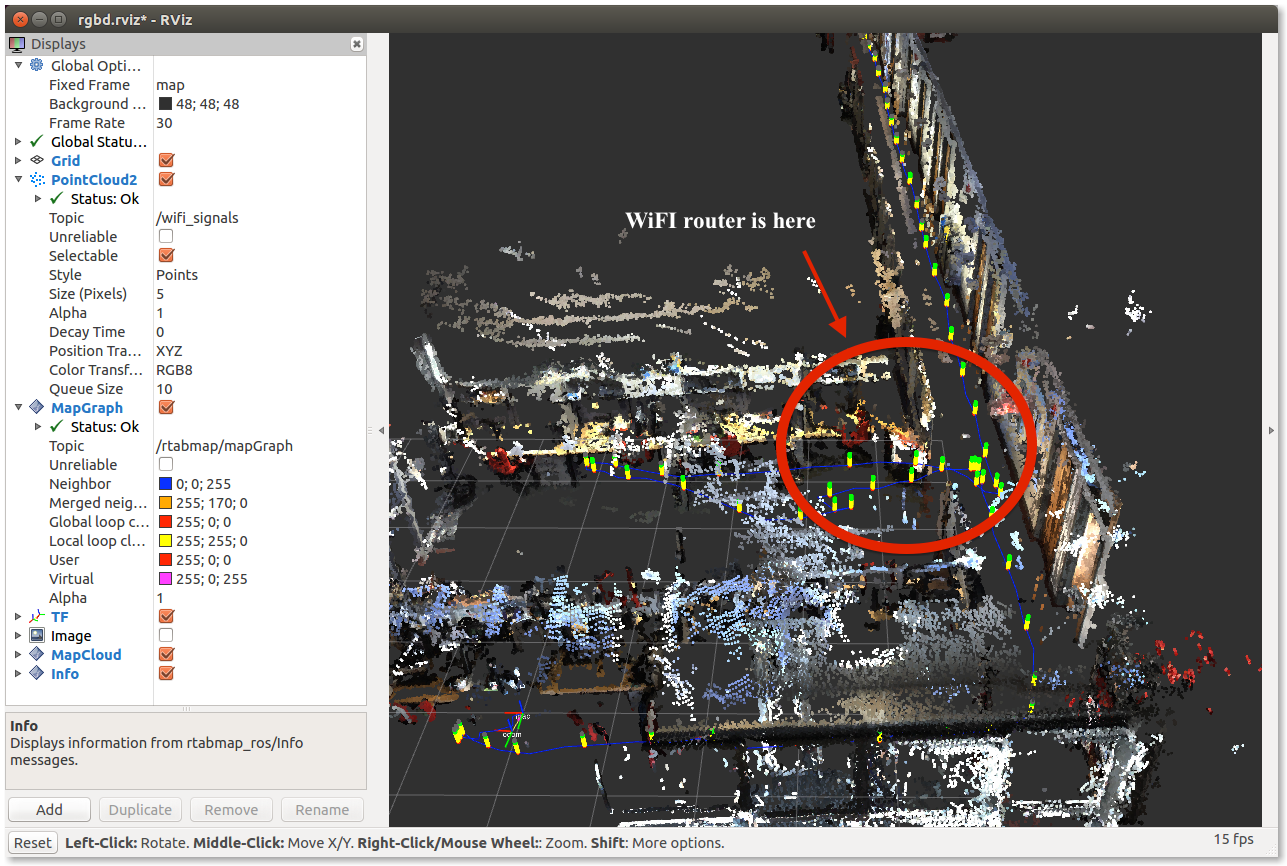
This tutorial will show how to create a map including information taken with any other sensor (e.g., the user data). For convenience, we will map Wifi signal strength of the environment. The screenshot below shows how the Wifi signal strength is visualized. It is just a level bar used (sensor_msgs/Pointcloud2), but more fancy output like Markers can be used to customize the look. 

How to Publish User Data (wifi_signal_pub)
To add user data to map, rtabmap node has topics called user_data and user_data_async. The first one is used when parameter subscribe_user_data:=true, and it will be synchronized with other sensor data. It means that the publishing rate of this topic should be high (at least as fast as the images received). The second topic user_data_async is asynchronous. It should be used only when user data is published slower than the detection rate of rtabmap (default 1 Hz). The received user data will be saved in the next node created in rtabmap (if user data is published faster than nodes are created, old user data will be overwritten).
For this example, we use user_data_async with a Wifi signal data published each 2 seconds. Here is the basic information needed to publish a rtabmap_msgs/UserData topic (the full code is here):
   1 #include <rtabmap_conversions/MsgConversion.h>
   2 #include <rtabmap_msgs/UserData.h>
   3
   4 int main(int argc, char** argv)
   5 {
   6    //... node initialization stuff
   7
   8    ros::Rate rate(0.5);
   9
  10    ros::Publisher wifiPub = nh.advertise<rtabmap_msgs::UserData>("wifi_signal", 1);
  11
  12    while(ros::ok())
  13    {
  14       ros::Time stamp = ros::Time::now();
  15
  16       // Get signal strength...
  17       int dBm = ...
  18
  19       // Create user data [level, stamp].
  20       // OpenCV matrix is used for convenience. Any format is accepted.
  21       // However, if CV_8UC1 format is used, make sure rows > 1 as
  22       // rtabmap will think it is already compressed.
  23       cv::Mat data(1, 2, CV_64FC1);
  24       data.at<double>(0) = double(dBm);
  25
  26       // We should set stamp in data to be able to
  27       // retrieve it from the saved user data as we need
  28       // to get precise position in the graph afterward.
  29       data.at<double>(1) = stamp.toSec();
  30
  31       rtabmap_msgs::UserData dataMsg;
  32       dataMsg.header.frame_id = "wifi_link";
  33       dataMsg.header.stamp = stamp;
  34
  35       // Convert OpenCV matrix to UserData msg. Optionally,
  36       // we can choose to compress the data now (here we keep uncompressed).
  37       rtabmap_conversions::userDataToROS(data, dataMsg, false);
  38
  39       // Publish data!
  40       wifiPub.publish<rtabmap_msgs::UserData>(dataMsg);
  41
  42       ros::spinOnce();
  43       rate.sleep();
  44    }
  45    return 0;
  46 }
Publisher example in Python
   1 #!/usr/bin/env python
   2 import rospy
   3 import struct
   4 import os
   5 from rtabmap_msgs.msg import UserData
   6
   7 def loop():
   8     rospy.init_node('wifi_signal_pub', anonymous=True)
   9     pub = rospy.Publisher('wifi_signal', UserData, queue_size=10)
  10     rate = rospy.Rate(0.5) # 0.5hz
  11     while not rospy.is_shutdown():
  12
  13         myCmd = os.popen('nmcli dev wifi | grep "^*"').read()
  14         cmdList = myCmd.split()
  15
  16         if len(cmdList) > 6:
  17             quality = float(cmdList[6])
  18             msg = UserData()
  19
  20             # To make it compatible with c++ sub example, use dBm
  21             dBm = quality/2-100
  22             rospy.loginfo("Network \"%s\": Quality=%d, %f dBm", cmdList[1], quality, dBm)
  23
  24             # Create user data [level, stamp].
  25             # Any format is accepted.
  26             # However, if CV_8UC1 format is used, make sure rows > 1 as
  27             # rtabmap will think it is already compressed.
  28             msg.rows = 1
  29             msg.cols = 2
  30             msg.type = 6 # Use OpenCV type (here 6=CV_64FC1): http://ninghang.blogspot.com/2012/11/list-of-mat-type-in-opencv.html
  31
  32             # We should set stamp in data to be able to
  33             # retrieve it from the saved user data as we need
  34             # to get precise position in the graph afterward.
  35             msg.data = struct.pack(b'dd', dBm, rospy.get_time())
  36
  37             pub.publish(msg)
  38         else:
  39             rospy.logerr("Cannot get info from wireless!")
  40         rate.sleep()
  41
  42 if __name__ == '__main__':
  43     try:
  44         loop()
  45     except rospy.ROSInterruptException:
  46         pass
How to Retrieve User Data (wifi_signal_sub)
rtabmap publishes rtabmap_msgs/MapData topic after each update. In this topic, we can get the user data that we published to rtabmap earlier, which is now linked to graph. Here is an example (the full code is here):
   1 #include <rtabmap_msgs/MapData.h>
   2 #include <rtabmap_conversions/MsgConversion.h>
   3
   4 std::map<double, int> wifiLevels;
   5 void mapDataCallback(const rtabmap_msgs::MapDataConstPtr & mapDataMsg)
   6 {
   7    // Convert MapData message in more user friendly objects
   8    rtabmap::Transform mapToOdom;
   9    std::map<int, rtabmap::Transform> poses;
  10    std::multimap<int, rtabmap::Link> links;
  11    std::map<int, rtabmap::Signature> signatures;
  12
  13    rtabmap_msgs::mapDataFromROS(*mapDataMsg, poses, links, signatures, mapToOdom);
  14
  15    // The user data of the latest node added to
  16    // map is contained in signatures map. Iterate over
  17    // to get the data. Handle the case where we can
  18    // receive only latest data, or if all data are published
  19    for(std::map<int, rtabmap::Signature>::iterator iter=signatures.begin(); iter!=signatures.end(); ++iter)
  20    {
  21       int id = iter->first;
  22       rtabmap::Signature & node = iter->second;
  23
  24       if(!node.sensorData().userDataCompressed().empty())
  25       {
  26          cv::Mat data;
  27          node.sensorData().uncompressDataConst(0 ,0, 0, &data);
  28
  29          if(data.type() == CV_64FC1 && data.rows == 1 && data.cols == 2)
  30          {
  31             // format [int level, double stamp], see wifi_signal_pub_node.cpp
  32             int level = data.at<double>(0);
  33             double stamp = data.at<double>(1);
  34             wifiLevels.insert(std::make_pair(stamp, level));
  35          }
  36          else if(!data.empty())
  37          {
  38             ROS_ERROR("Wrong user data format for wifi signal.");
  39          }
  40       }
  41    }
  42
  43    // "wifiLevels" contains all signal values sorted
  44    // by timestamp. We can then find their exact position
  45    // on the graph. See referred source code for details...
  46 }
  47
  48
  49
  50 int main(int argc, char** argv)
  51 {
  52    //... node initialization stuff
  53
  54    ros::Subscriber mapDataSub = nh.subscribe("/rtabmap/mapData", 1, mapDataCallback);
  55
  56    ros::spin();
  57 }
Example of Usage
From the hand-held tutorial, start your camera and launch rtabmap.launch with argument "user_data_async_topic:=/wifi_signal", then start wifi publisher and subscriber:
$ roslaunch rtabmap_launch rtabmap.launch [...] user_data_async_topic:=/wifi_signal

// C++:
$ rosrun rtabmap_demos wifi_signal_pub _interface:="wlan0"
// Python:
$ python wifi_signal_pub.py

$ rosrun rtabmap_demos wifi_signal_sub
In RVIZ, add PointCloud2 topic called wifi_signals published from wifi_signal_sub node. Note that you may need to start wifi_signal_pub in sudo. To do so:
$ sudo su
$ source /opt/ros/kinetic/setup.bash
$ source /home/{user_name}/catkin_ws/devel/setup.bash (if rtabmap is built from source)
$ rosrun rtabmap_demos wifi_signal_pub interface:="wlan0"
If you move the camera, you should see the signal strength bars like in the screenshots above.
Example of Result
You can show the map of the screenshots above using this database demo_wifi.db (taken with a stereo camera) with the lines below:
$ roslaunch rtabmap_launch rtabmap.launch database_path:=~/Downloads/demo_wifi.db rtabmap_viz:=false rviz:=true
$ rosrun rtabmap_demos wifi_signal_sub
// In RVIZ, add `PointCloud2` topic called `wifi_signals`
$ rosservice call /rtabmap/publish_map 1 1 0


