Only released in EOL distros:
Package Summary
robot_monitor is a simple GUI tool for displaying robot diagnostics that has been aggregated by the diagnostic_aggregator.
Some icons from the Silk icon pack are used, which is available from famfamfam.com.
- Author: Kevin Watts (watts@willowgarage.com), Josh Faust (jfaust@willowgarage.com)
- License: BSD
- Repository: ros-pkg
- Source: svn https://code.ros.org/svn/ros-pkg/stacks/diagnostics_monitors/tags/diagnostics_monitors-1.4.0
Package Summary
robot_monitor is a simple GUI tool for displaying robot diagnostics that has been aggregated by the diagnostic_aggregator.
Some icons from the Silk icon pack are used, which is available from famfamfam.com.
- Author: Kevin Watts (watts@willowgarage.com), Josh Faust (jfaust@willowgarage.com)
- License: BSD
- Source: svn https://code.ros.org/svn/ros-pkg/stacks/diagnostics_monitors/trunk
Contents
![]() This pkg is no longer actively maintained and superceded by rqt plugin, rqt_robot_monitor.
This pkg is no longer actively maintained and superceded by rqt plugin, rqt_robot_monitor.
Robot Monitor Overview
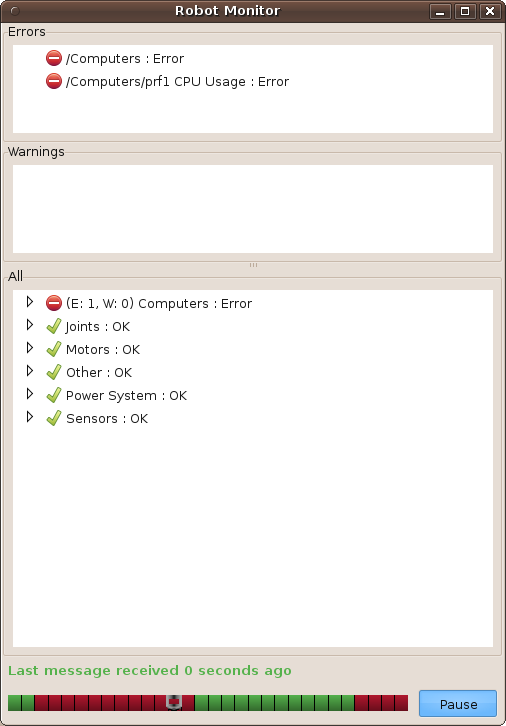
The robot_monitor package provides the Robot Monitor GUI that displays the aggregated diagnostics from a robot. The Robot Monitor subscribes to the /diagnostics_agg topic, which is published by the diagnostic_aggregator, and displays the diagnostics in a tree form. The Robot Monitor is integrated as part of the pr2_dashboard, but it can also be used as a stand-alone tool to monitor a robot.
For a full tutorial, see Using the Robot Monitor.
Usage
Run the monitor with:
rosrun robot_monitor robot_monitor
Rxbag Plugin
New in ROS C-Turtle
The robot_monitor can view messages of type diagnostic_msgs/DiagnosticArray when used as an rxbag plugin. This feature is experimental.
You'll have to toggle the "Pause" button to start moving along with normal time again.
Main Window

The Errors and Warnings boxes always show any available errors or warnings respectively in a list view -- i.e. there is no tree structure.
The All box contains the tree of all the items in the diagnostics tree, with errors and warnings signaled by icons.
The timeline on the bottom allows you to scrub through time to help debug intermittent errors. When you start scrubbing through time the monitor will pause itself:

Status Viewers
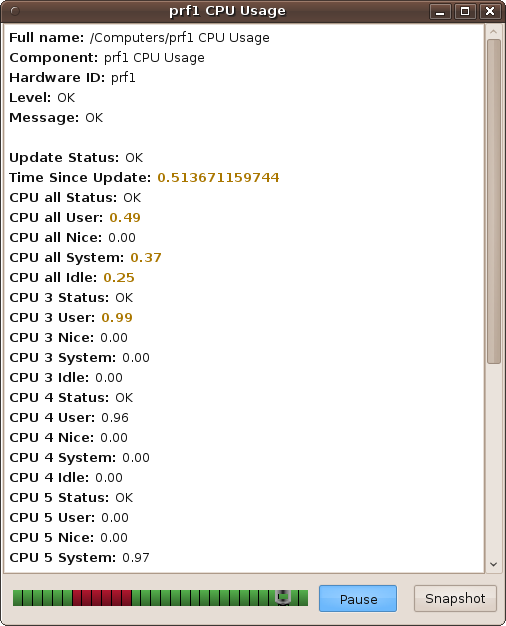
Double-clicking on any of the status items on the main frame will pop up a status viewer:

Items which have changed since the last message are highlighted in gold.
The status viewers also have a timeline of their own. If the main frame is paused, these timelines will be disabled. Otherwise they let you scrub through messages independently.
Node API
robot_monitor
Starts the standalone robot monitor.Subscribed Topics
/diagnostics_agg (diagnostic_msgs/DiagnosticArray)- Aggregated diagnostics published by diagnostic_aggregator


