Show EOL distros:
Package Summary
This package is used for the visualization of the models in the dome/mild environment
- Maintainer: Meißner Pascal <asr-ros AT lists.kit DOT edu>
- Author: Allgeyer Tobias, Braun Kai, Heller Florian, Mehlhaus Jonas, Meißner Pascal, Qattan Mohamad, Wittenbeck Valerij
- License: BSD
- Source: git https://github.com/asr-ros/asr_visualization_server.git (branch: master)

Contents
Description
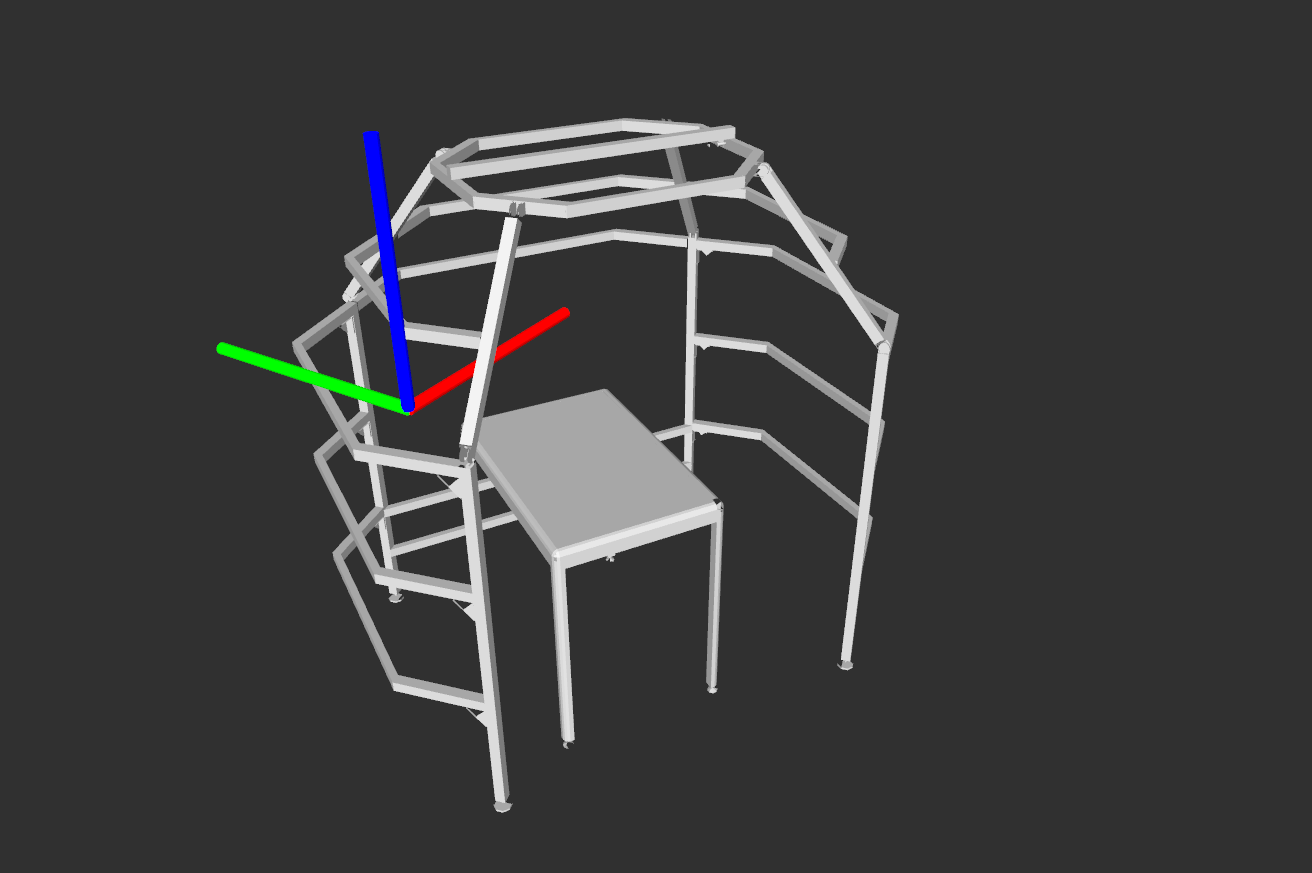
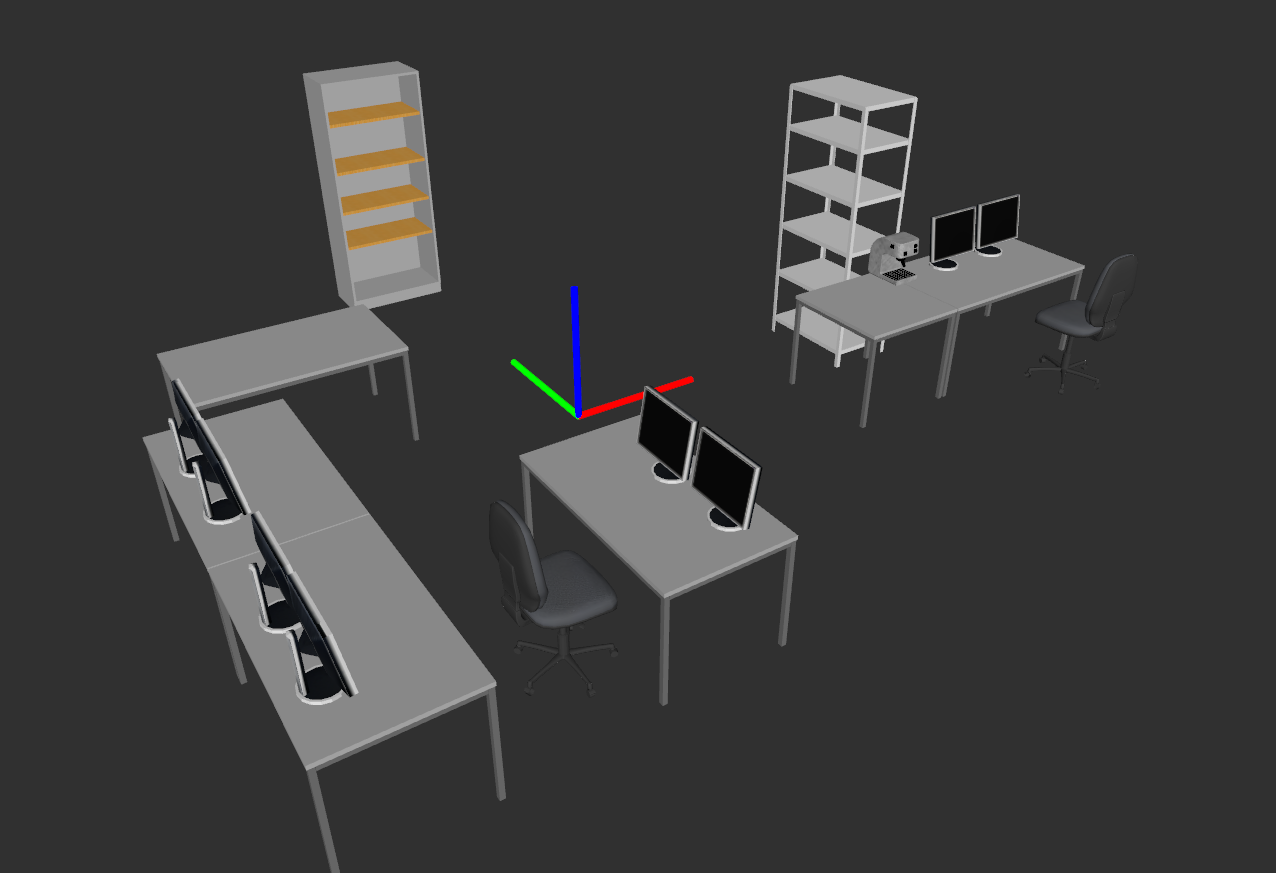
This package is used to visualize the environment models (e.g. tables, monitors, ...) used in the experimental setup of the ASR-Lab at the KIT. The two environments (mild and dome) contained in this package refer to the two lab-rooms the shown models are currently placed in.
Mild environment example: |
Dome environment example: |
Functionality
Basically what this program does is querying the models which are stored in the object_database and publishing them as RViz-Markers so they can be visualized. The poses of the used models are stored in an xml-file and are static during the runtime.
Usage
Needed packages
Build and runtime:
Runtime only:
Start system
To start the program run the following command:
roslaunch asr_visualization_server visualization.launch
Now you can call one of the provided services described below to visualize the models you want to.
ROS Nodes
Published Topics
visualization_msgs::MarkerArray: This array contains the models of the objects which shall be visualized in RViz, the topic-name can be set in the configuration file (see 4.3)
Parameters
All parameters of this package can be set in the visualization_params.yaml file located in the param directory:
dome_config_path: This is the path (absolute or relative to the package directory) to the xml-file containing information about the objects in the dome environment which shall be recognized
mild_config_path: Similar to dome_config_path this is the path to the xml-file for the mild environment
output_topic: The name of the topic the visualized objects are published on
publish_rate: The period between the visualization cycles (if this is 0.5 for example then the models will be visualized every 0.5 seconds)
marker_lifetime: The duration after which the visualized markers will be deleted automatically (this should be greater than publish_rate so that the markers are shown constantly in rviz)
XML-Files
As mentioned in the parameters above there are two xml-files containing information about the objects in the two provided environments (mild and dome), these are stored in the config directory of the package by default.
You can add or delete objects from the environments by altering those files or you can use your own file if it has the same layout as the ones provided. To be valid the file needs to have a root node called "markers", the actual objects are child nodes of this node and are called "marker". Each marker node needs to have the following attributes:
name: The name of the object (e.g. "table")
scale: Three scaling factors, one for each dimension, stored as a comma separated string. The values of this attribute depend on the scale of your mesh-model (e.g. "0.1,0.1,0.1")
mesh: The path to a mesh-file which containes a 3D-model of the object. The format is the URI-form used by the resource_retriever of ROS (see here). As all provided markers in the default xml-configs use models stored in the object_database-package this package is needed during runtime or rviz won't be able to visualize them (e.g. "package://asr_object_database/rsc/databases/environment/TableDome/TableDome.dae")
use_mat: If this is true and the mesh is of a type which supports embedded materials (such as COLLADA), the material defined in that file will be used instead of a default color (e.g. "1")
The value of the marker node is the pose of the object relative to the \map frame (stored as position_x, position_y, position_z, rotation_w, rotation_x, rotation_y, rotation_z).
Example:
<markers>
     <marker name="dome" scale="0.1,0.1,0.1" mesh="package://asr_object_database/rsc/databases/environment/Dome/Dome.dae" use_mat="0">1,-0.189,-1.77,-0.681189,-0.681488,0.188607,0.189693</marker>
     <marker name="table" scale="0.1,0.1,0.1" mesh="package://asr_object_database/rsc/databases/environment/TableDome/TableDome.dae" use_mat="0">0.9,0.6,-1.77,0.31,0.31,-0.56,-0.56</marker>
</markers>
Provided Services
Several services are provided to control which objects shall be shown during runtime:
ClearAllModels: Clears the list of all models currently to be visualized
- Parameters: -
ClearModelDome: Removes one model from the list of models to be visualized in the dome environment
- Parameters:
- name (string): The name of the model to be removed
- Parameters:
ClearModelMild: Removes one model from the list of models to be visualized in the mild environment
- Parameters:
- name (string): The name of the model to be removed
- Parameters:
DrawAllModelsDome: Adds all available objects of the dome environment (provided in the xml-file) to the list of objects to visualize
- Parameters: -
DrawAllModelsMild: Adds all available objects of the mild environment (provided in the xml-file) to the list of objects to visualize
- Parameters: -
DrawModelDome: Adds one model of the dome environment to the list of objects to visulalize
- Parameters:
- name (string): The name of the model to be added
- Parameters:
DrawModelMild: Adds one model of the mild environment to the list of objects to visulalize
- Parameters:
- name (string): The name of the model to be added
- Parameters:
ShowAvailableModels: Returns lists of the names of all available models (one for each environment: dome, mild)
- Parameters: -
Tutorials
For most applications it is sufficient to start the program as stated in 3.4 and then call one of the services to draw all models depending on the environment you want to visualize (DrawAllModelsDome or DrawAllModelsMild).


