| Note: This tutorial assumes that you have completed the previous tutorials: Running a simple grasp script. |
| |
Live visualization of a script
Description: This tutorial teaches you how to visualize a running script.Tutorial Level: BEGINNER
Start the Script Viewer
To start the script viewer type
rosrun cob_script_server script_viewer.py
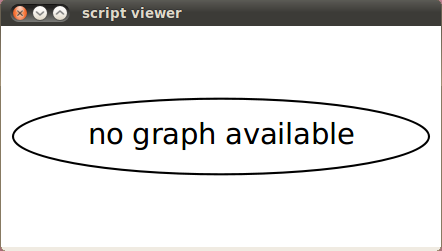
You should see a new window saying "no graph available"

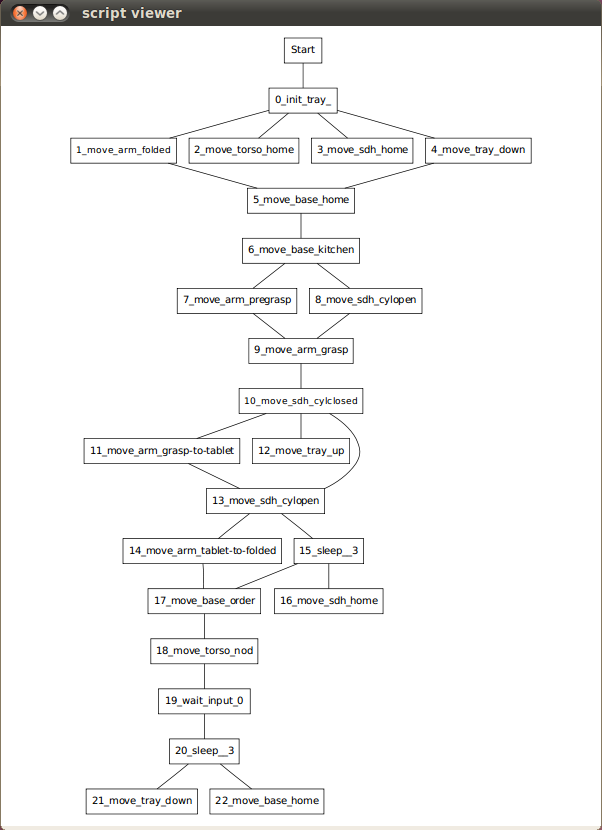
or if you already executed a script showing the graph of the last script.

Run a Script and follow the status in the Script Viewer
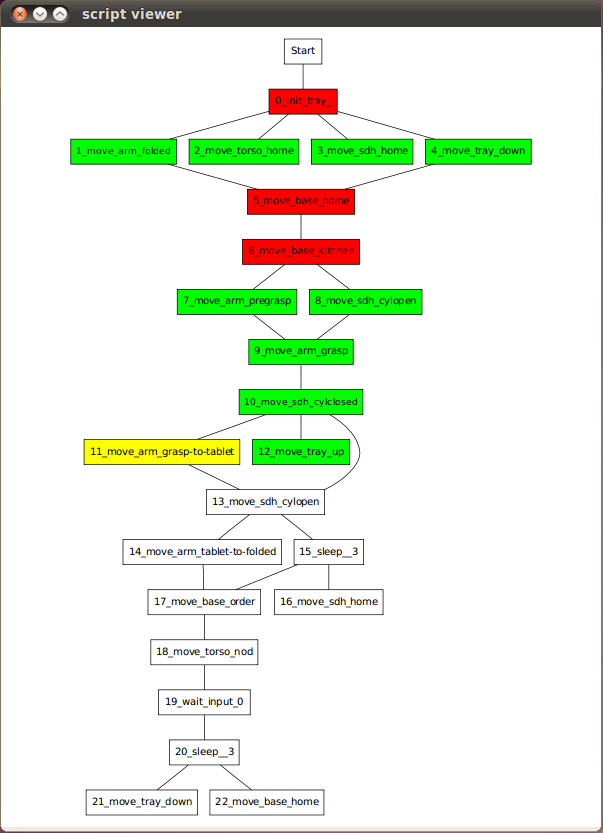
Now you can run a script as described in the running a simple script tutorial and use to script viever to monitor the execution state of the script. The colors in the block represent the different states according to the following table.
color |
state |
white |
not active |
yellow |
active |
red |
failed |
green |
succeeded |


