Only released in EOL distros:
Package Summary
The indoor_localization package
- Maintainer status: developed
- Maintainer: Elcin Erdogan <elcin.erdogan AT inovasyonmuhendislik DOT com>
- Author:
- License: Apache 2.0
- Source: git https://github.com/inomuh/indoor_localization.git (branch: kinetic-devel)
Contents
ROSinPS Project
Indoor positioning is the basic need of technologies required for Industry 4.0. Some examples of these technologies are autonomy of unmanned mobile robots, personnel and asset tracking, personnel navigation and location-based services. With the realization of technologies, applications like autonomous mobile robots, monitoring efficiency (OEE, KPI, reliability) of equipments, dynamic routing for mobile robots, real time stock tracking, location-based emergency detection can be developed in order to increase the productivity.
The objective of this project is to develop an open source generic ROS package for absolute indoor positioning. In order to make the ROS package sensor independent, a specific message type called sensor_msgs/AnchorScan that includes the coordinates and TDOA measurements of the anchors from which signal received will be defined. At the end of the project, an open source generic ROS package and necessary indoor algorithms will be developed for indoor positioning system developers and users. This ROS package will be compatible with other ROS stacks and packages like robot_localization, move_base, navigation etc. In addition, in this ROS package, a ROS node will be developed for the calculation of KPI parameters.
Software quality assurance will be considered. Maintenance for the package will be supported by Inovasyon Muhendislik Ltd.
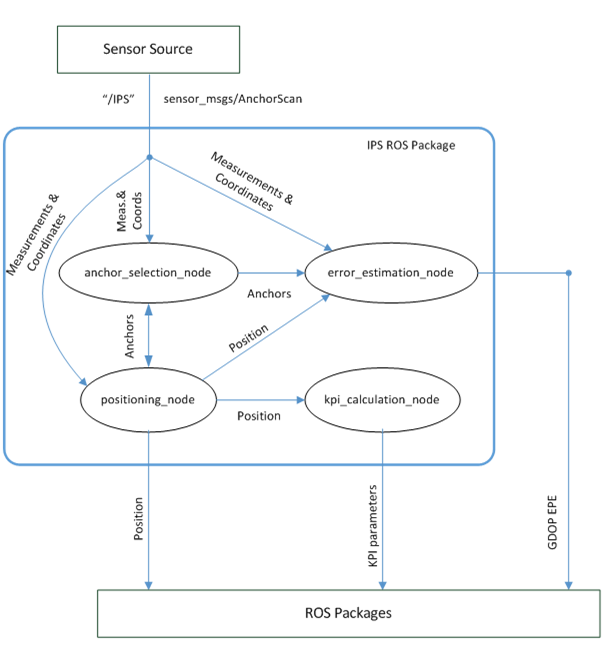
IPS ROS Package Setup
|
Studies
1D Positioning Algorithm
The developed algorithm, locates tags that moves on a straight line. Although the system is a 1D localization system, the lines can be in 3D environment. Using Time Difference of Arrival (TDOA) measurements and making tags as passive receivers, the limit on the number of tags is removed. In this method, there is no need for time synchronization between anchors and tags.
An iterative method is proposed to overcome the complexity of calculations to implement the system with low computational power. In this procedure, only two anchors are enough in order to locate all tags which are able to receive the transmissions of anchors.
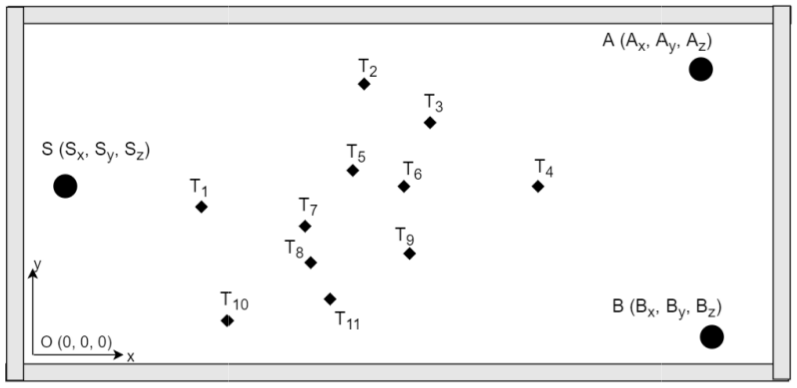
The sample usage of the system is given in figure below. S and A represent anchors and Ti represent tags.
|
Decawave development kits are used in tests which has a good performance among other UWB transceivers. The developed algorithm was tested in the office environment. Although normally, tag and anchors have Line of Sight (LOS), during the tests, sometimes LOS has been lost since the movement of personel.
Coordinates of points are measured with cm resolution according to the origin. A ruler was constructed on the line L1-L2. Anchors S, A and B are placed which are not far than 10m from each other. In previous works, it was observed that anchors can be far away as much as 100m from each other.
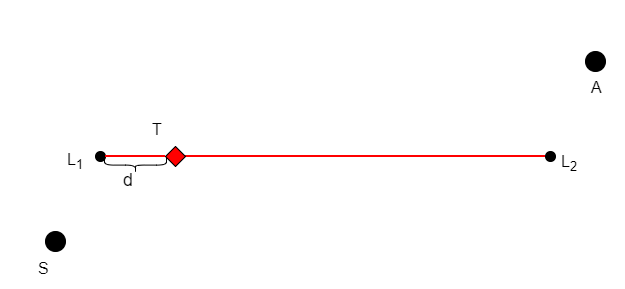
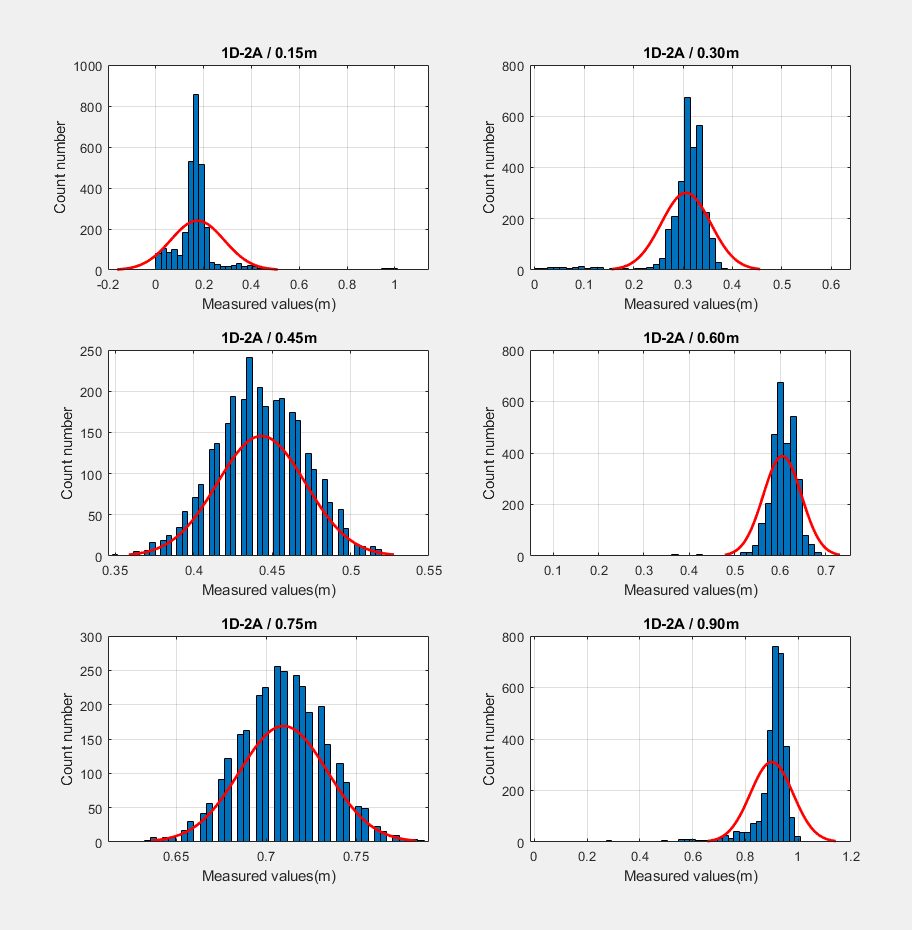
Tests are done at 6 different tag distance - d which are 0.15m, 0.30m, 0.45m, 0.60m, 0.75m, 0.90m. The refresh rate is selected as 25Hz. Theoretically, it can be beyond 100Hz. At each distance, 3000 measurements are logged as is without any outlier rejection, filter or calibration.
The logged measurements can be found in:https://github.com/inomuh/indoor_localization.git
The histogram and fitted gaussian pdf graphs of test results are shown in figure below:
|
Mean, mean error, standart deviation for each test are given in table below:
Distance(d) |
Mean(µ)(m) |
Mean Error(µe)(m) |
Std. Deviation(m)(σ) |
0.15m |
0.174 |
0.024 |
0.112 |
0.30m |
0.306 |
0.006 |
0.05 |
0.45m |
0.443 |
0.007 |
0.028 |
0.60m |
0.605 |
0.005 |
0.042 |
0.75m |
0.710 |
0.04 |
0.024 |
0.90m |
0.899 |
0.001 |
0.081 |
2D Positioning Algorithm
The proposed system, locates tag that moves on a ground plane therefore it is a 2D positioning system. TDOA measurements are used, so only anchors transmit and tags are passive listeners. In this method, there is no need for time synchronization between anchors and tags. Since tags do not transmit, theoretically there is no limit in the number of tags which can be located by the system.
Iterative method is proposed to overcome the complexity of calculations to implement the system with low computational power. In this procedure, only three anchors are enough in order to locate all tags which are able to receive the transmissions of anchors.The sample usage of the system is given in figure below. S, A and B represent anchors and Ti represent tags.
|
Tests are done at 6 different points of the tag which are;
|
x(m) |
y(m) |
z(m) |
P1 |
2.25 |
1.35 |
1.72 |
P2 |
3.60 |
1.35 |
1.72 |
P3 |
4.95 |
1.35 |
1.72 |
P4 |
2.25 |
2.7 |
1.72 |
P5 |
3.60 |
2.7 |
1.72 |
P6 |
4.95 |
2.7 |
1.72 |
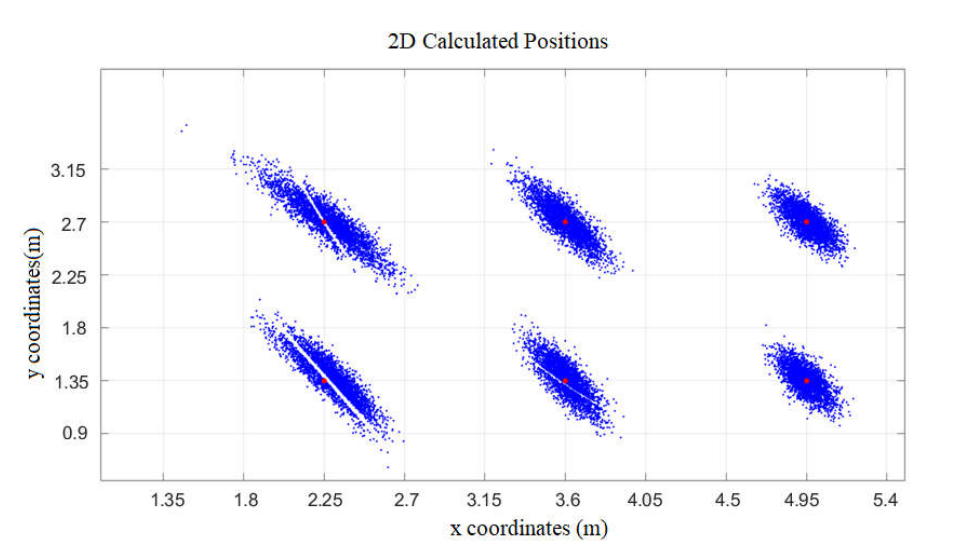
At each test points, 3000 measurements are logged as is without any outlier rejection, filter or calibration.
The graph of 2D test results is shown in figure below. Red dots indicate the real points and blue dots indicate the measurement results:
|
Mean, mean error, standart deviation for each test are given in table below:
Points |
Mean(µ)(m) |
Mean Error(µe)(m) |
Std.Deviation(m)(σ) |
P1 |
(2.293, 1.373) |
0.197 |
0.124 |
P2 |
(3.607, 1.360) |
0.151 |
0.097 |
P3 |
(4.947, 1.355) |
0.115 |
0.072 |
P4 |
(2.271, 2.705) |
0.215 |
0.144 |
P5 |
(3.601, 2.704) |
0.158 |
0.104 |
P6 |
(4.955, 2.695) |
0.122 |
0.075 |
3D Positioning Algorithm
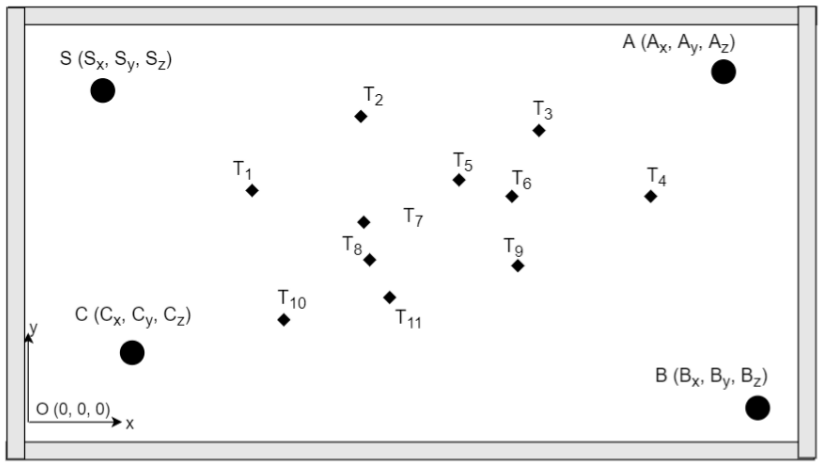
The proposed system, locates tag that moves in a 3D office environment. TDOA measurements are used, so only anchors transmit and tags are passive listeners. In this method, there is no need for time synchronization between anchors and tags as before. Since tags do not transmit, theoretically there is no limit in the number of tags which can be located by the system.
Also, iterative method is proposed to overcome the complexity of calculations to implement the system with low computational power. In this procedure, only four anchors are enough in order to locate all tags which are able to receive the transmissions of anchors. The sample usage of the system is given in figure below. S, A, B and C represent anchors and Ti represent tags.
|
Tests are done at 8 different points of the tag which are;
|
x(m) |
y(m) |
z(m) |
P1 |
2.70 |
1.35 |
0.44 |
P2 |
3.60 |
1.35 |
0.44 |
P3 |
2.70 |
2.25 |
0.44 |
P4 |
3.60 |
2.25 |
0.44 |
P5 |
2.70 |
1.35 |
1.72 |
P6 |
3.60 |
1.35 |
1.72 |
P7 |
2.70 |
2.25 |
1.72 |
P8 |
3.60 |
2.25 |
1.72 |
At each test points, 3000 measurements are logged as is without any outlier rejection, filter or calibration.
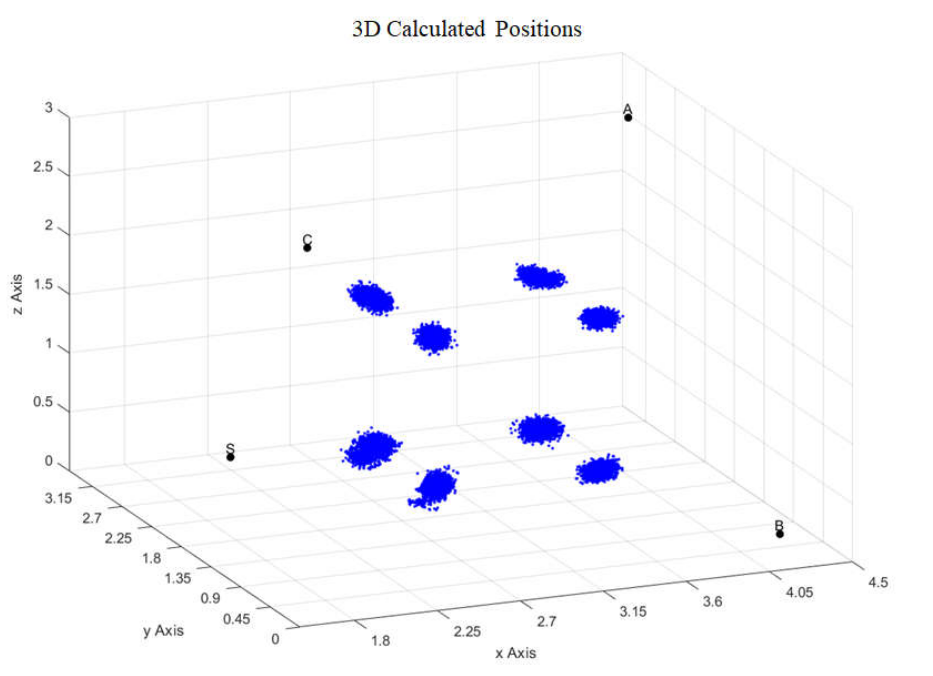
The graph of 3D test results is shown in figure below. Red dots indicate the real points, blue dots indicate the measurement results and black dots indicate the places of anchor S,A,B and C :
|
Mean, mean error, standart deviation for each test are given in table below:
Points |
Mean(µ)(m) |
Mean Error(µe)(m) |
Std.Deviation(m)(σ) |
P1 |
(2.73, 1.37, 0.45) |
0.067 |
0.034 |
P2 |
(3.60, 1.34, 0.43) |
0.055 |
0.028 |
P3 |
(2.70, 2.25, 0.44) |
0.065 |
0.037 |
P4 |
(3.60, 2.25, 0.44) |
0.071 |
0.036 |
P5 |
(2.71, 1.36, 1.72) |
0.051 |
0.024 |
P6 |
(3.61, 1.35, 1.72) |
0.050 |
0.024 |
P7 |
(2.70, 2.25, 1.72) |
0.056 |
0.027 |
P8 |
(3.60, 2.25, 1.72) |
0.054 |
0.028 |
Accuracy Analysis
Purpose of the Study
2D positioning algorithm calculates the position of the tag. In order to evaluate the practical usage of the algorithm in the industry, the sensitivity of the result to the noise at the input must be analyzed. Therefore, it is important to find the parameters that the variance of the output depends on and the relation with them when the tag is at a fixed point. The purpose of this study is to estimate the error in the calculated 2D position with the analysis mentioned above.
Proposed Work
For 2D, probable error can be expressed in common with CEP, DRMS, R95, 2DRMS. These values show the minimum radius of circle (centered at the true position) containing the position estimate with the approximate probability given below.
CEP: |
50 % |
DRMS: |
65 % |
2DRMS: |
95 % |
R95: |
95 % |
For instance, If CEP is 2 meters, 50% of calculated positions have error smaller than 2 meters. For this study, DRMS is used for measure of estimated error for 2D respectively. DRMS is defined as follows:
|
Validation of the Algorithm
In 2D Positioning algorithm , the real tests done for the validation of the 2D localization algorithm. In those tests, the position was calculated 3000 times for each test point. For each test point, experimental ![]() is calculated from the standard deviation of these 3000 instances.
is calculated from the standard deviation of these 3000 instances.
σ(das) = σ(dbs) = σ(c) = 0.0625 is calculated. This values depends on both hardware used and test environment.
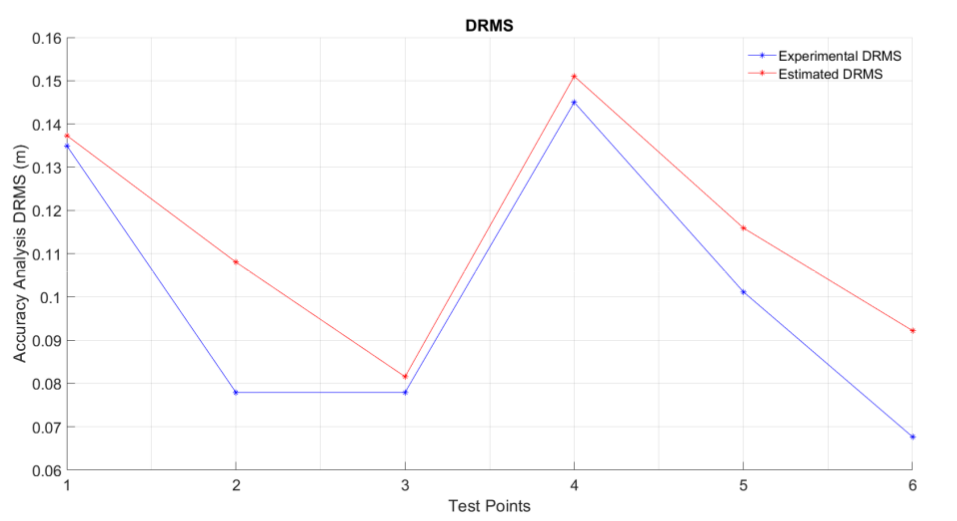
In following table, comparison of estimated DRMS with experimental DRMS at 6 test points.
|
P1 |
P2 |
P3 |
P4 |
P5 |
P6 |
Experimental DRMS |
0.1350 |
0.0779 |
0.0779 |
0.1450 |
0.1011 |
0.0677 |
Accuracy Analysis DRMS |
0.1373 |
0.1080 |
0.0816 |
0.1510 |
0.1159 |
0.0922 |
|
Anchor Selection
Purpose of the Study
Indoor localization systems must be scalable, because the localization may be applied in a large indoor area such as hangar, factory etc. In order to cover a large area, more than 3 or 4 anchors must be used since the signal of an anchor may not reach to whole area. In that case, mobile robot has to choose the anchors whose signals will be used in position calculation. Due to the effect of the anchor geometry on the accuracy of the position calculation, it is important to choose the right anchors.
In literature PDOP is the term describing the quality of the geometry and in 2D it can be defined as:
|
Low PDOP value refers to good anchors geometry therefore indicates high accuracy.
The purpose of study is to select the right anchors for high positioning accuracy using low PDOP selection criteria.
Proposed Work
In a large indoor area, signals from all anchors may not be received. Therefore, according to the location of the tag, different anchor combinations must be selected to get the high positioning accuracy.
The first criteria in anchor selection is the reception of the signal since without signal reception there is nothing to do. The second criteria is the PDOP value. Among the anchors whose signals are received, the triple combination which has the lowest PDOP value must be selected for high positioning accuracy. Therefore all triple combinations of those anchors must be analyzed. In calculating PDOP, the last calculated position of tag can be used because the positioning refresh rates are generally high considering the mobile robot movement.
Validation of the Algorithm
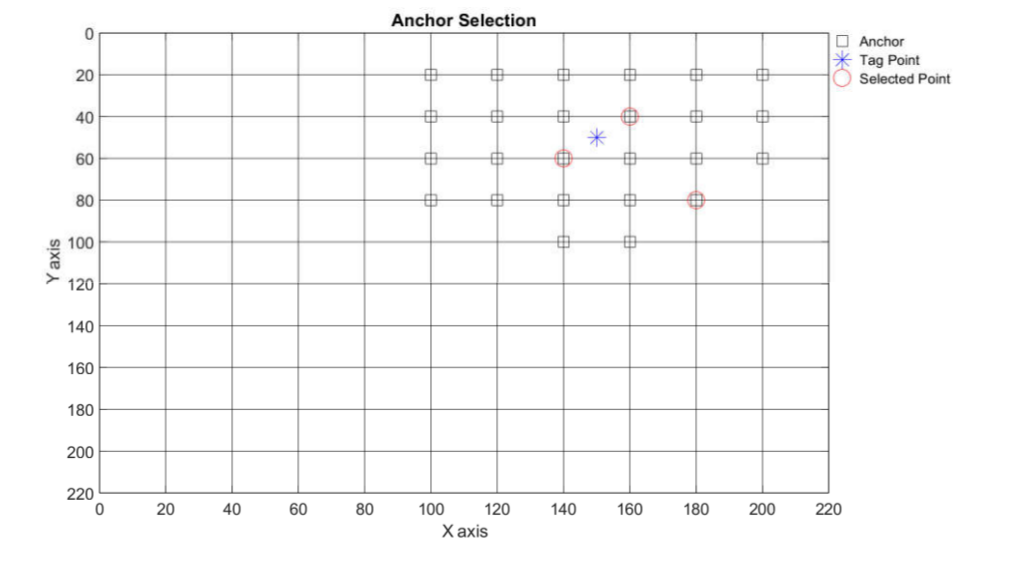
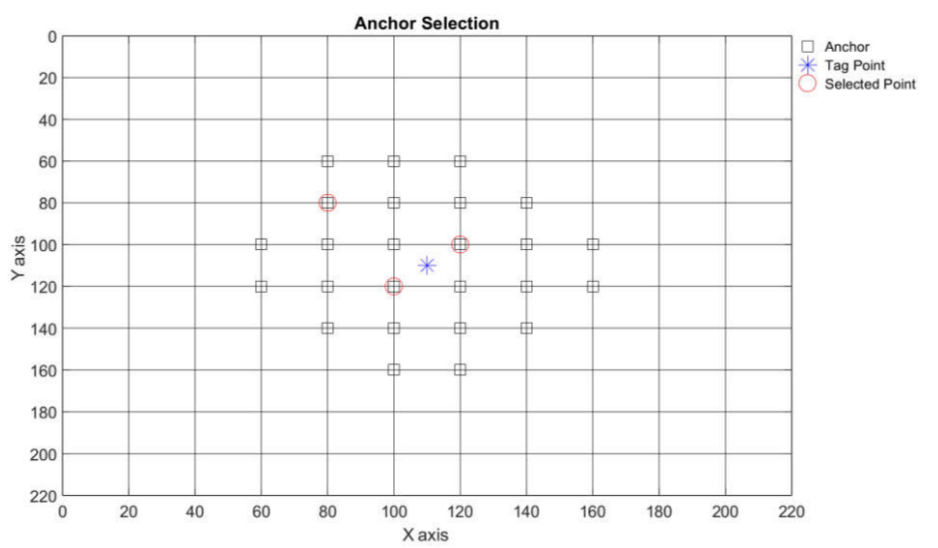
The validation of the anchor selection algorithm is done with random cases. Each case has a arbitrarily positioned tag and randomly selected 25 anchors around it. In each case, algorithm calculates the triple that has the lowest PDOP. The 2 example cases are given below:
Case 1:
|
Case 2:
|
Key Performance Indicators (KPI) Calculation
Purpose of the Study
Key performance indicators is a type of performance measurements. KPIs evaluate the success of work such as organization, algorithm, activity ect. Different KPIs can be defined for different case. The important point is that choosing right KPIs provides a right evaluation of the success of the work.
The purpose of this study is to define location based KPIs for mobile robots.
Proposed Work
The main duty of a mobile robot is mobility, therefore movement is considered as work. The basic outputs of positioning systems (time and location) are used as inputs of the proposed KPIs. Based on time and location information, “distance taken” and the “motion time” can be calculated. These calculations can also be done on a regional basis using location. Regions can be defined with corners coordinates.
The following KPIs are defined for mobile robots whose positions are determined by the positioning system.
KPI 1: Distance Travelled
Distance Travelled shows total distance taken by mobile robot over the specified period such as working hours. It is defined as the summation of all individual distances taken over the period.
|
It’s a simple metric but it serves as the cornerstone. This KPI shows the mobility of the mobile robot.
KPI 2: Idle Time
Idle Time is the total of time that the mobile robot is stationary while it is running over the specified period . It is defined as the summation of all individual stationary times over the period.
|
This KPI generally shows that how much time the mobile robot is unused. Most of the case, more Idle Time indicates less Efficiency.
KPI 3: Motion Time
Motion Time is the total of time that the mobile robot is moving over the specified period. It is defined as the summation of all individual movement times over the period.
|
This KPI generally shows that how much time the mobile robot is used. Motion time can be interpreted as the working time of the mobile robot. Most of the case, more Motion Time indicates high Efficiency.
KPI 4: Efficiency
The main duty of a mobile robot is to move. Therefore, efficiency can be defined as how much of the period it moves. It is defined as the percentage of the motion time to specified period.
|
The period used in Efficiency KPI and Motion Time KPI must be the same. This KPI, with the working time versions, is one of the main indicators used in all industrial sectors.
KPI 5: Region Based Distance Travelled
This KPI is a region specific version of the Distance Travelled KPI. It uses only distances taken in the specified region over the specified period.
|
This KPI can be used for regional analysis of the mobility. It can also be used to check forbidden zones enterance and travelled distance in them.
KPI 6: Region Based Total Time
Region Based Total Time is the total of time that the mobile robot is in the specified region over the specified period . It is defined as the summation of all individual elapsed times in the region over the period.
|
This KPI can be used for regional analysis of the presence. It can also be used to check forbidden zones enterance and time elapsed in them.
KPI 7: Region Based Idle Time
This KPI is a region specific version of the Idle Time KPI. It uses only stationary times in the specified region over the specified period. It is defined as the summation of all individual stationary times in the region over the period.
|
This KPI can be used for regional analysis of the idle time of the mobile robot. Generally, the less efficient regions have more region based idle time.
KPI 8: Region Based Motion Time
This KPI is a region specific version of the Motion Time KPI. It uses only movement times in the specified region over the specified period. It is defined as the summation of all individual movement times in the region over the period.
|
This KPI shows how much time the mobile robot is used in that region. Generally, the less efficient regions have less region based movement time.
KPI 9: Region Based Efficiency
This KPI is a region specific version of the Efficiency KPI. It is defined as the percentage of the Region Based Motion Time to the Region Based Total Time.
|
The region used Region Based Motion Time and Region Based Total Time must be the same. This KPI can be used for regional analysis of the efficiency of the mobile robot.
Acknowledgements

Supported by ROSIN - ROS-Industrial Quality-Assured Robot Software Components.
More information: rosin-project.eu
|
This project has received funding from the European Union’s Horizon 2020 |


