| |
Aggregate, store and visualise statistics
Description: This tutorial will show you how to publish some data using pal_statistics, aggregate it using statsdcc, store it with graphite and visualize it with grafanaKeywords: pal_statistics, logging, statsd, graphite, grafana
Tutorial Level:
Contents
Graphite and Grafana
Go to https://github.com/pal-robotics/pal_statistics/tree/kinetic-devel/docker and follow the README instructions to build and run the pal_statistics docker image. Make sure the to make available all the specified ports. Running this docker will start a graphite carbon server and grafana web server.
Check that both carbon-cache and grafana-server are running.
Graphite will save all reported stats to a whisper database and grafana will allow us to visualise it. There is also a collectd demon that will automatically log system information.
More information about Graphite: https://graphite.readthedocs.io/en/latest.
More information about Grafana: https://grafana.com/docs.
Publish statistics
The following example shows how to publish a random value
   1 #!/usr/bin/python
   2
   3 import random
   4 import rospy
   5 from pal_statistics import StatisticsRegistry
   6
   7
   8 def get_my_var():
   9     return random.random()
  10
  11
  12 def publish_callback(event):
  13     registry.publish()
  14
  15
  16 rospy.init_node("my_stats_node")
  17
  18 registry = StatisticsRegistry("/my_statistics_topic")
  19
  20 registry.registerFunction("my_var", get_my_var)
  21
  22 rospy.Timer(rospy.Duration(0.01), publish_callback)
  23
  24 rospy.spin()
Get it from my_stats.py and run it with python my_stats.py. This example will log a float value between 0 and 1 at 100Hz. Check the statistics generated by echoing the topics in the /my_statistics_topic namespace
Statsd
Build
Statsd is daemon that listens for statistics sent over UDP or TCP and sends aggregates to one or more pluggable backend services. In our case the chosen backend is Graphite.
There are multiple implementations of statsd. More information at https://github.com/statsd/statsd.
For this tutorial we choose a C++ implementation called statsdcc. There is a fork at https://github.com/pal-robotics/statsdcc that also adds a plugin for reading statistics from pal_statistics.
Clone and build it.
Configuration
The statsdcc node will look, in its namespace, for a ros parameter topics that specifies the configuration.
Here is the topics configuration for our example.
topics:
    - name: '/my_statistics_topic'
      stats:
          - name: 'my_var'
            type: ['t']
Get it from topics.yaml. We will use the statsdcc_node namespace. Load the configuration with rosparam load topics.yaml statsdcc_node.
Note that name accepts regex so you don't need to create rules for every one of your logged variables. If you change 'my_var' for 'my_*' it will aggregate the data of all the variables that start with 'my_'. You may add several rules for each topic.
There are two types of metrics: timers (t) and gauges (g). Timers will give you a summary of the aggregated data (count, lower, upper and average) while gauge will show the last value logged. For this tutorial we will use timers.
Run
Finally, download the server aggregator.json configuration and start it with:
rosrun statsdcc statsdcc [path_to_aggregator.json] __name:=statsdcc_node
This node will subscribe to the specified statistics topics and aggregate all the data. You will see log messages about my_var statistic processing. The aggregation, as specified by the frequency parameter in the aggregator.json, happens every 60 seconds
Visualisation
Open a web browser at http://localhost:3000. This is the Grafana server.
Default username and password is admin.
Configure a data source
Click Add data source and select Graphite.
Set HTTP > URL to http://localhost:80
Click Save & Test. You should see a "Data source is working" message.
Create a dashboard
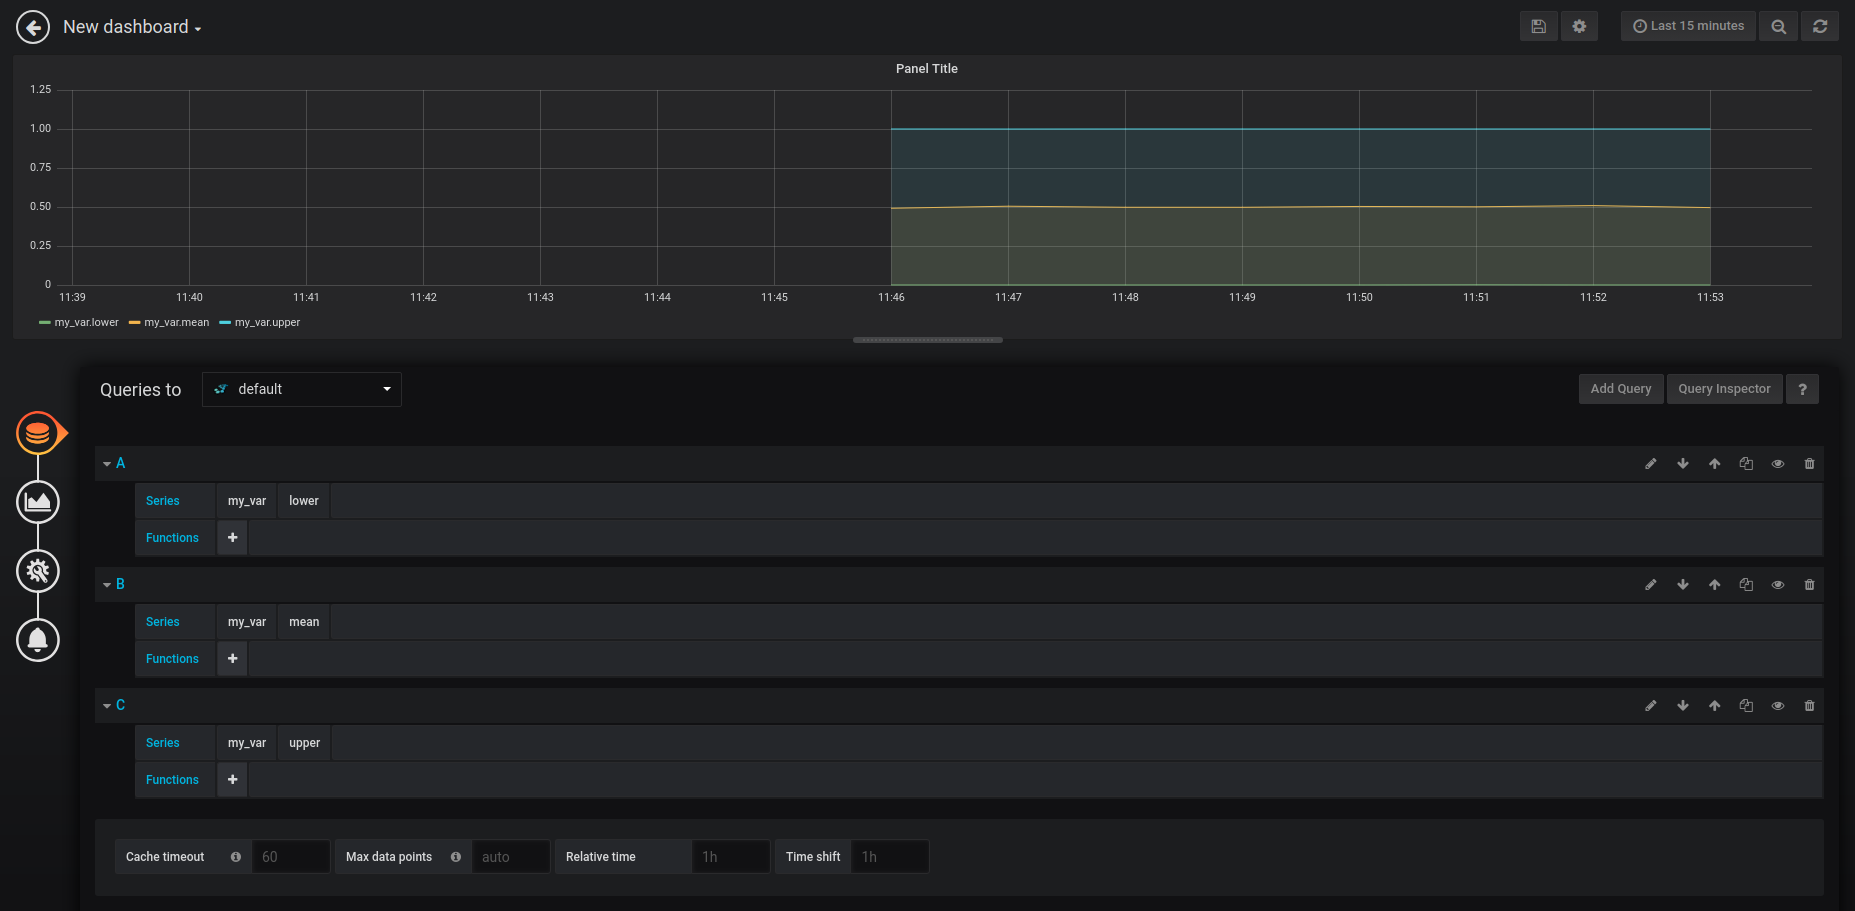
Click the + on the left panel and select Dashboard. Click Add Query. Create three queries for lower, mean and upper my_var as shown in the image below.

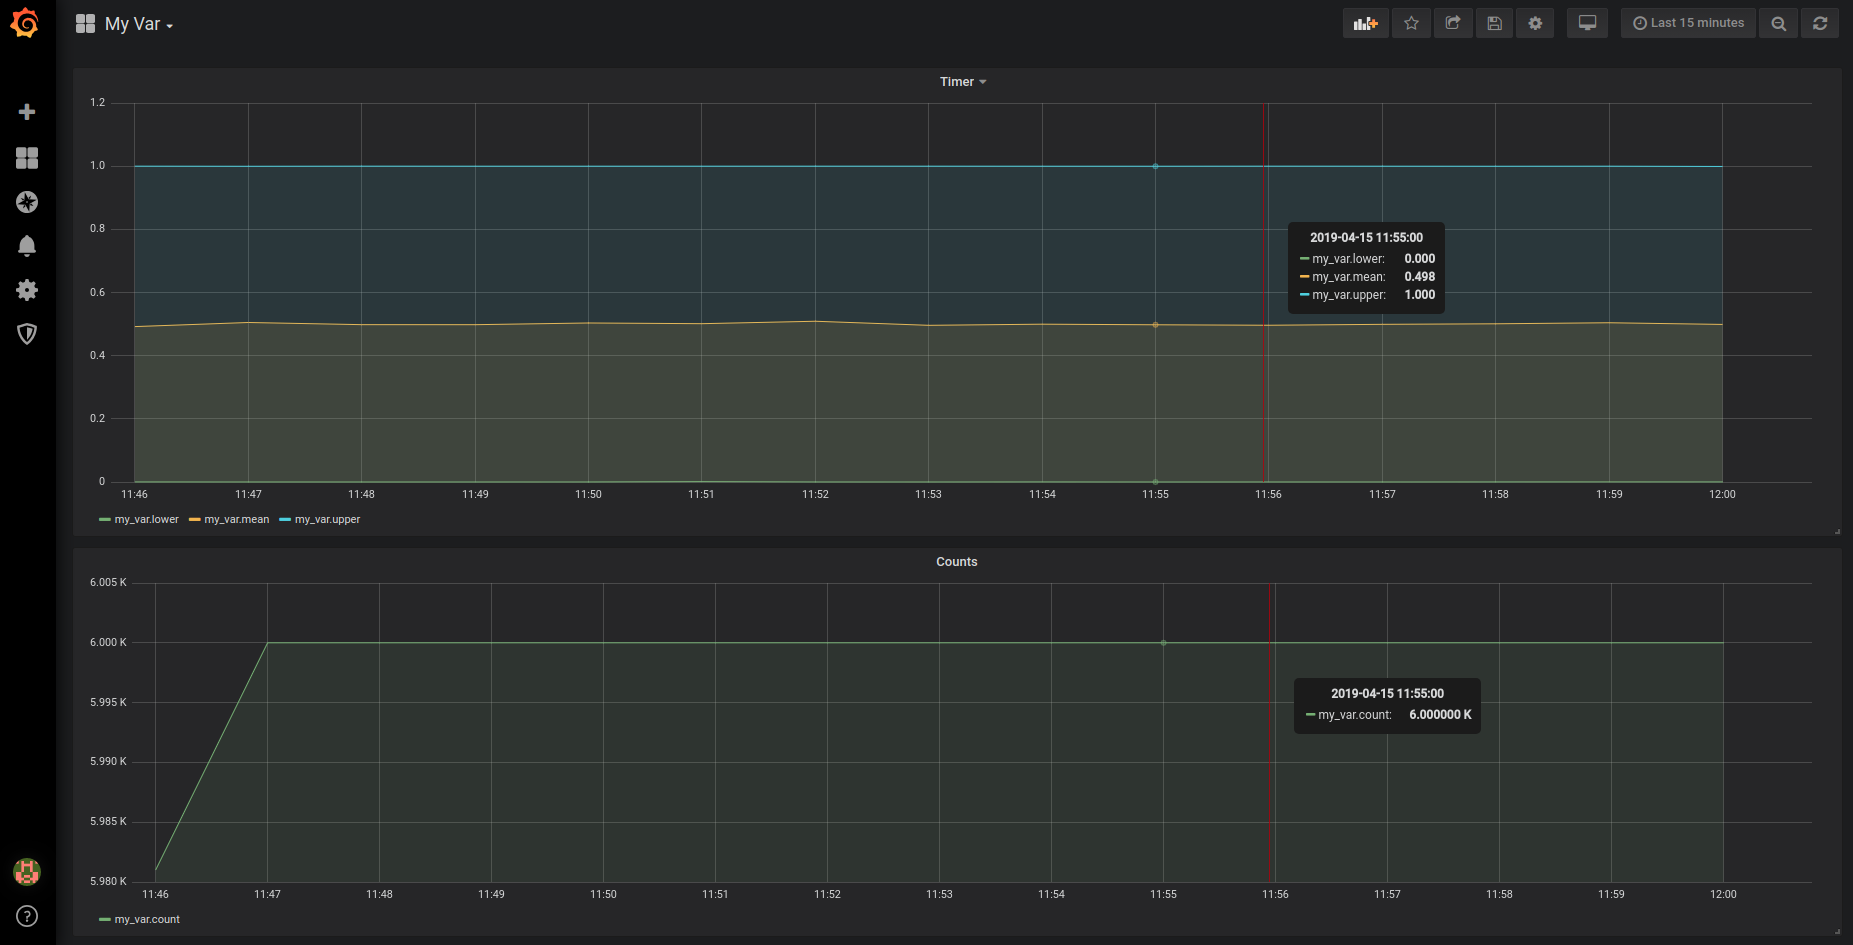
Go back and add a new panel by clicking the icon on the upper right corner. Once again, click Add Query. This time create a query for my_var.count. Go back.
You can now visualise the aggregated information for my_var. We are logging about 6000 values per minute. You should the see the lower value very close to 0.0, the upper close to 1.0 and the mean close to 0.5.


