Contents
There are a number of tools to help you debug tf related problems. Most of them are located inside the bin directory or the scripts directory. This page gives a description of each tool, and explains what type of problems you can resolve with each tool.
Frame poses
tf_echo
Tf echo is the simplest tool to look at the numeric values of a specific transform. Tf echo takes two arguments: the reference frame and the target frame. The output of tf echo is the target frame represented in the reference frame. E.g. to get the transformation from turtle1 to turtle2, type:
$ rosrun tf tf_echo turtle1 turtle2
The expected output looks something like this:
At time 1253924110.083
- Translation: [-1.877, 0.415, 0.000]
- Rotation: in Quaternion [0.000, 0.000, -0.162, 0.987]
            in RPY [0.000, -0.000, -0.325]
At time 1253924111.082
- Translation: [-1.989, 0.151, 0.000]
- Rotation: in Quaternion [0.000, 0.000, -0.046, 0.999]
            in RPY [0.000, -0.000, -0.092]
....
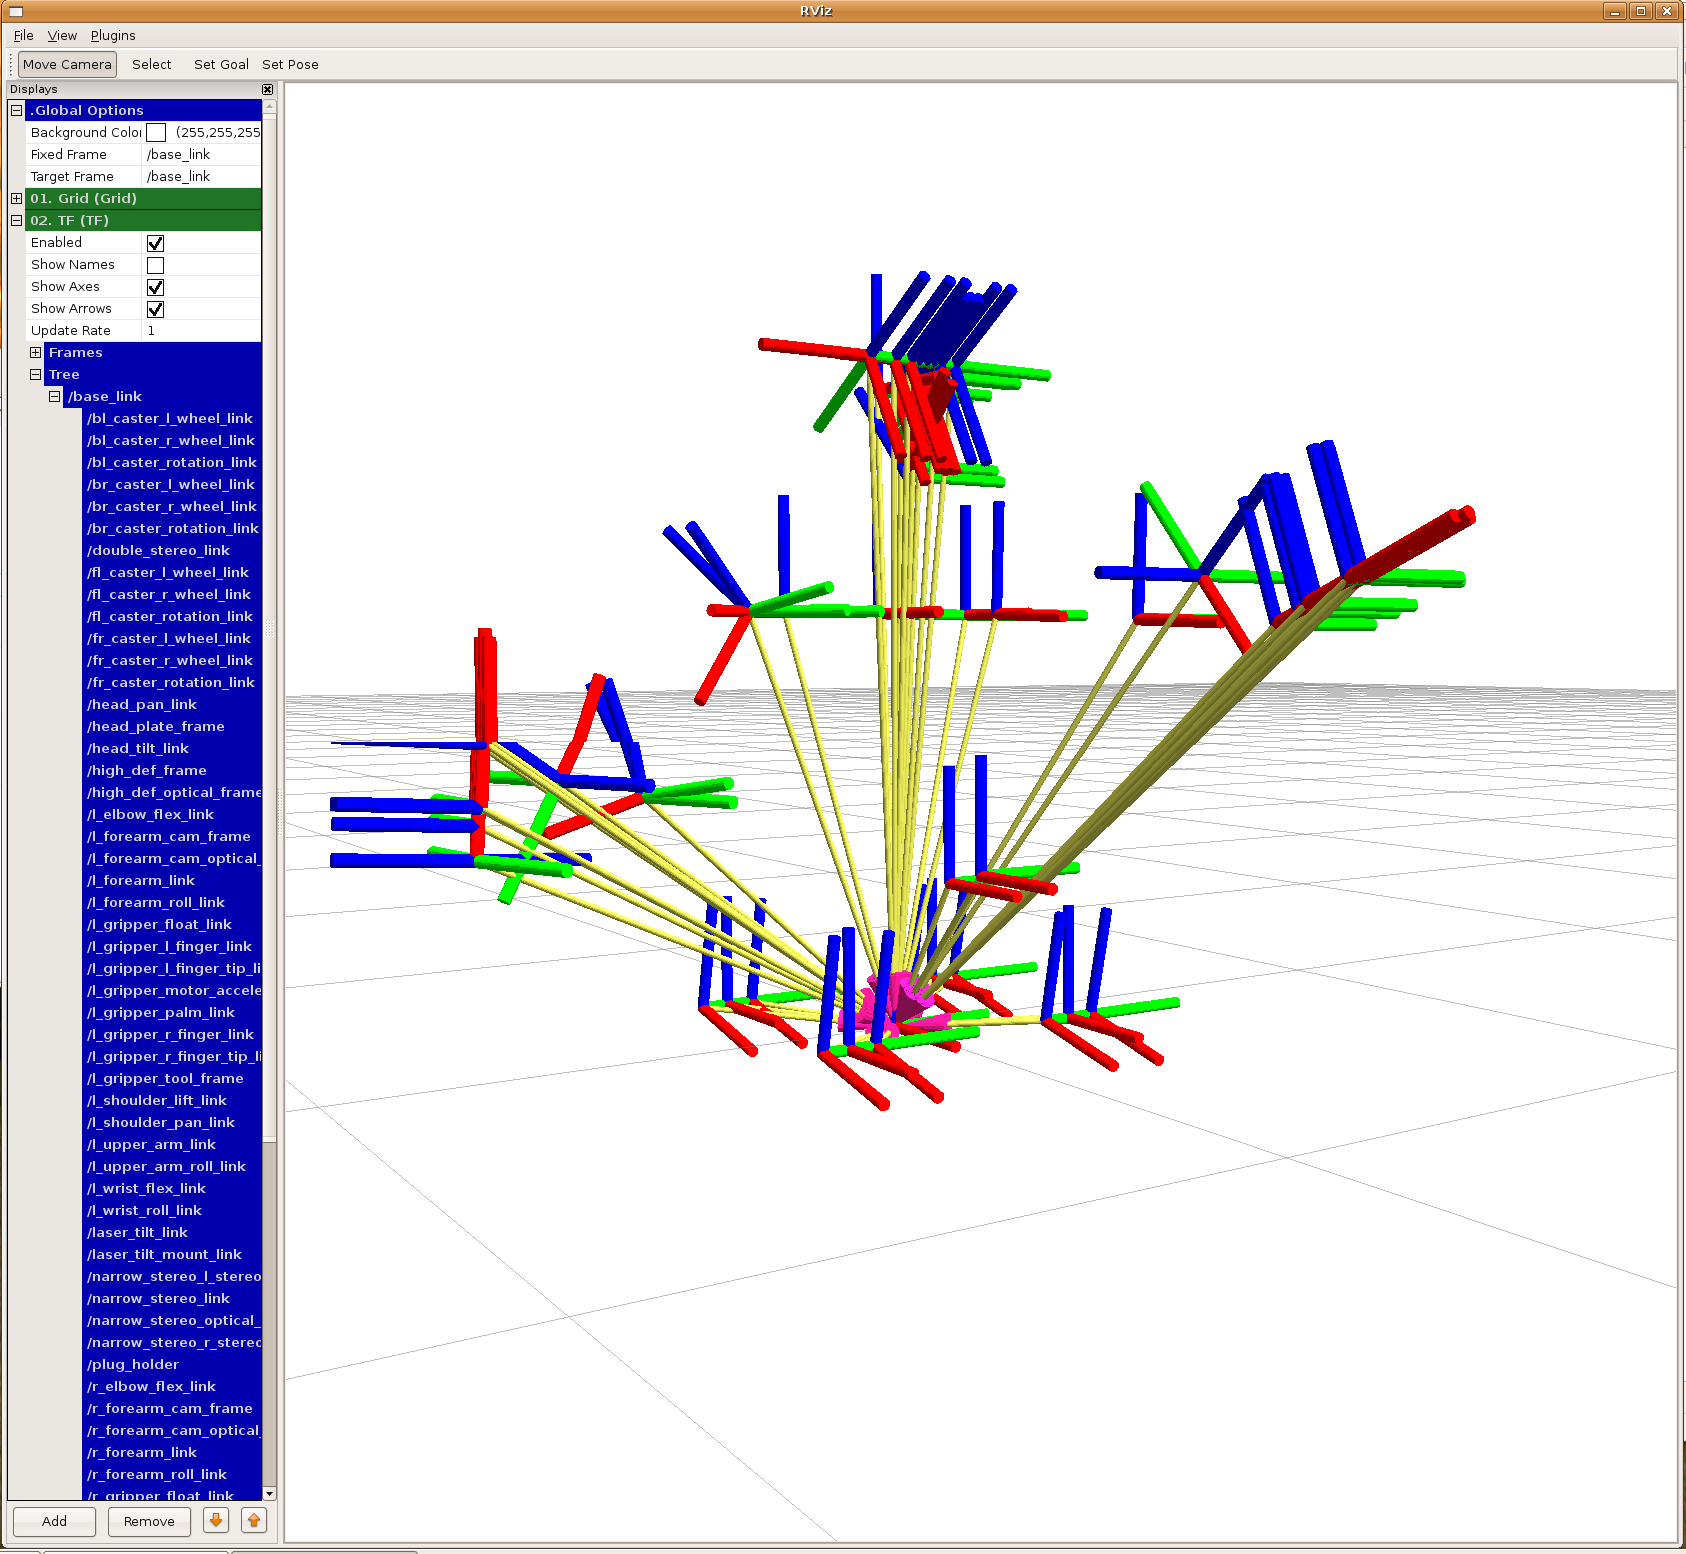
Rviz

Tf tree introspection
view_frames
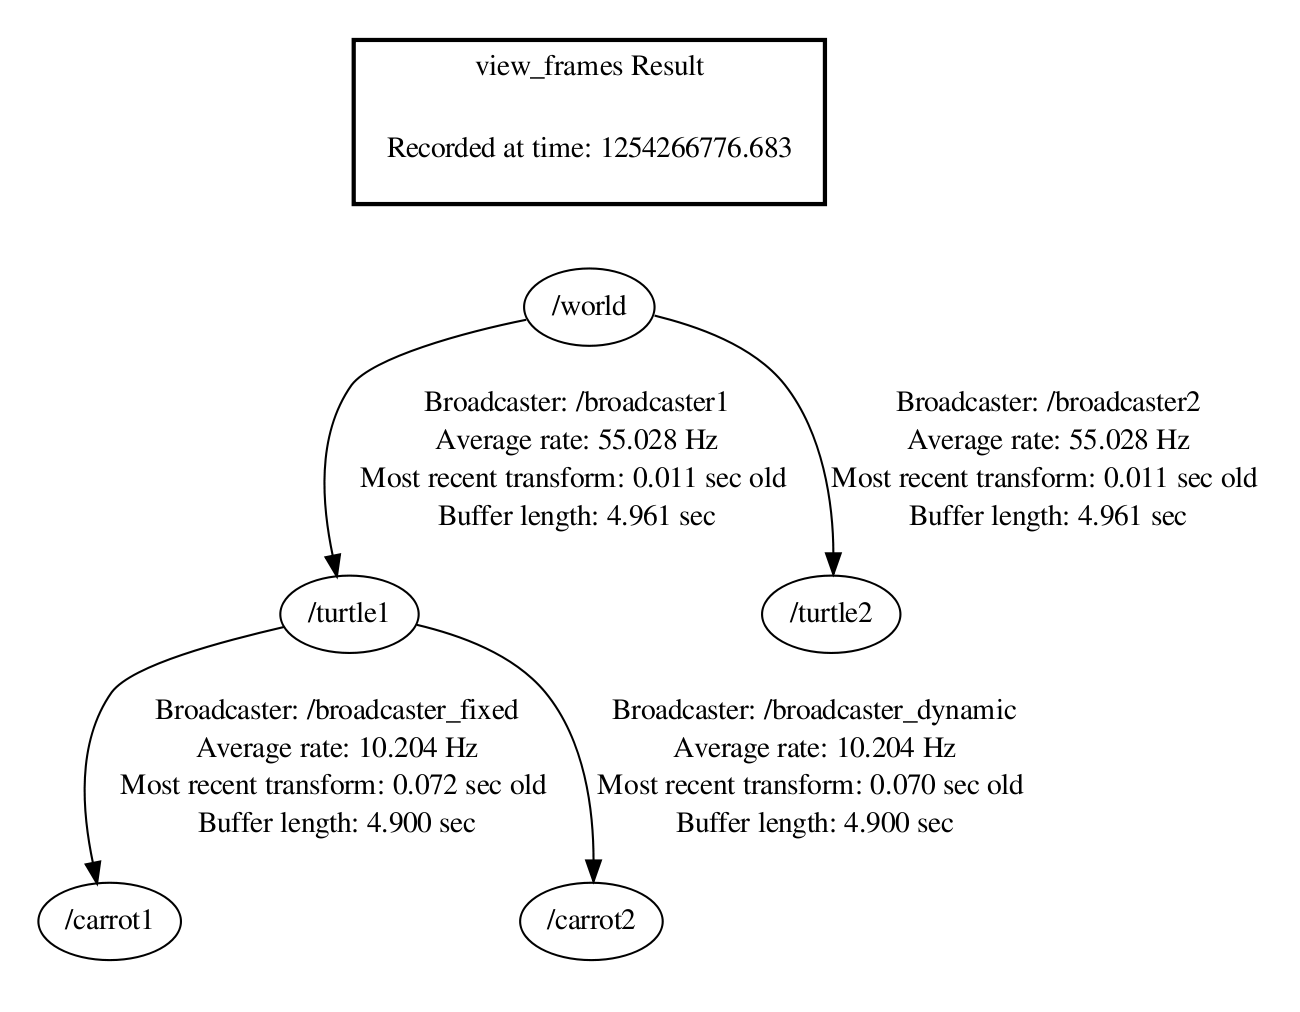
View frames can generate a pdf file with a graphical representation of the complete tf tree. It also generates a number of time-related statistics. To run view frames, type:
$ rosrun tf view_frames
In the current working folder, you should now have a file called "frames.pdf". Open the file:
$ evince frames.pdf
and you should see something like this: 
The Recorded time shows the absolute timestamp when this graph was generated.
The Broadcaster gives the name of the node that broadcasted the corresponding transform.
The Average rate gives the average frequency at which the broadcaster sent out the corresponding transform. Note that this is an average, and does not guarantee that the broadcaster was sending transforms the whole time.
The Most recent transform tells you how long ago the last transform was received. This is the time delay of a transform.
The Buffer length tells you how many seconds of data is available in the tf buffer. When you run view frames without specifying a node, this buffer length should be about 5 seconds.
Query a running node
If a specific node is having trouble its exact data can be queried using the following command.
rosrun tf view_frames --node=NODE_NAME
This will produce the same frames.pdf.
tf_monitor
Tf monitor can give you a lot of detailed information about a specific transformation you care about. The monitor will break down the chain between two frames into individual transforms, and provide statistics about timing, broadcasters, etc.
E.g. you want more information about the transformation between the frame "map" and the frame "torso_lift_link", simply type:
$ rosrun tf tf_monitor base_link torso_lift_link
The output should look something like this:
RESULTS: for /turtle1 to /turtle2
Chain currently is: /turtle2 -> /turtle1
Net delay     avg = 0.008786: max = 0.02799

Frames:

Broadcasters:
Node: /turtle1_tf_broadcaster 40.01705 Hz, Average Delay: 0.0001427 Max Delay: 0.0003479
Node: /turtle2_tf_broadcaster 40.01705 Hz, Average Delay: 0.0001515 Max Delay: 0.00034
You can see that the transformation between "map" and "torso_lift_link" consists of 5 different frames: map -> odom_combined -> base_footprint -> base_link -> torso_lift_link.
Each of these frames can be published by a different broadcaster.
roswtf
RosWTF is a tool that inspects a running system, and reports everything that looks suspicious. Roswtf is used for more than just debugging tf, but its output includes a section with specific tf debugging information.
Run roswtf:
$ roswtf
and in the output, look for the section about tf:
...
Loaded plugin tf.tfwtf
Package: tf
================================================================================
Static checks summary:

Found 2 warning(s).
Warnings are things that may be just fine, but are sometimes at fault

WARNING The following packages need genmsg() in CMakeLists.txt:
 * tf

WARNING The following packages need gensrv() in CMakeLists.txt:
 * tf


