| Note: This tutorial assumes that you have completed the previous tutorials: Command Line Tools. |
| |
Gateway Graph
Description: Visually monitoring a gateway networkKeywords: rocon, multimaster, gateway
Tutorial Level: BEGINNER
Contents
Overview
Sometimes it's convenient to get a graphical view of what is going on, particular once your gateway network gets complicated. The gateway graph is an rqt plugin in the same style as the original rxgraph tool that illustrates the connections and interfaces between gateways.
Launching
Can't see much without a running gateway network, so let's fire one up with three running gateways and advertise/flip/pull a few topics between them. The following rocon launcher does that:
> rocon_launch rocon_gateway_tutorials gateway_graph.concert
Rqt Gateway Graph
You can launch from any ros system to get a view from the perspective of that system. Here that means launching from 11312, 11313 or 11314. Here we'll launch from the first gateway:
> export ROS_MASTER_URI=http://localhost:11312
> rocon_gateway_graph
Graphs
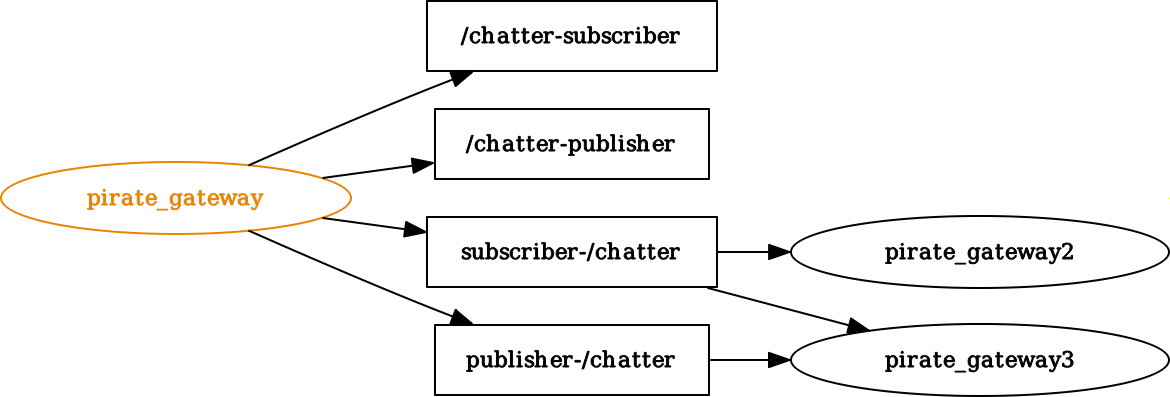
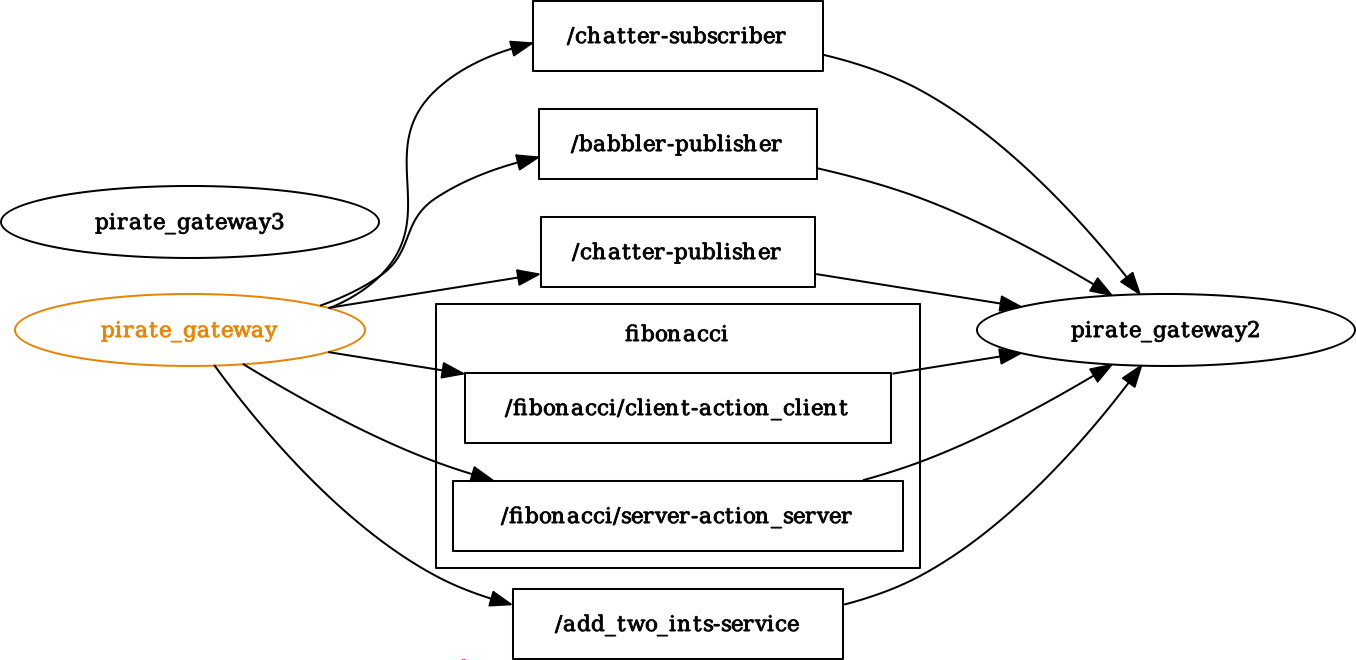
These images are from groovy's tutorial, but conceptually illustrate equally as well. |
From the perspective of the first gateway, the gateway view:

Advertisements and pulled connections:

Flipped connections:


