| |
Plot mtrace data from Shadow Hand device
Description: Plot mtrace data from Shadow Hand deviceTutorial Level:
Contents
Introduction
The driver for the Ethercat Shadow Hand will keep a 1-second buffer of status and command data for all actuators. When certain events occur, the driver will publish the status buffer for all actuators. The message is latched topic, so any tool can read the last published message message after it occurred.
Checking for mtrace topics
The Shadow hand driver will publish traces on different topic for each joint. The topic name should be /motor/trace/<joint-name>. Try using this following command get a list of motor_trace topics for the shadow hand:
rostopic list | grep motor_trace/srh
You should get a list like :
/motor_trace/srh_ffj0
/motor_trace/srh_ffj3
/motor_trace/srh_ffj4
/motor_trace/srh_lfj0
/motor_trace/srh_lfj3
/motor_trace/srh_lfj4
/motor_trace/srh_lfj5
/motor_trace/srh_mfj0
/motor_trace/srh_mfj3
/motor_trace/srh_mfj4
/motor_trace/srh_rfj0
/motor_trace/srh_rfj3
/motor_trace/srh_rfj4
/motor_trace/srh_thj1
/motor_trace/srh_thj2
/motor_trace/srh_thj3
/motor_trace/srh_thj4
/motor_trace/srh_thj5
/motor_trace/srh_wrj1
/motor_trace/srh_wrj2
Ask driver to publish buffer
Its possible to ask Shadow driver to publish buffer by making a service request to pr2_etherCAT (where Shadow driver have been loaded as plugin). This command will ask all devices to publish motor trace.
Run:
rosrun pr2_etherCAT publish_trace.py
View motor trace data
With rostopic
Its easy to get the last published motor trace with rostopic. Run:
rostopic /motor_trace/srh_ffj4 | more
The motor trace message contains a lot of data, so we pipe the rostopic echo output into the using program more.
Here is the first part of the rostopic echo output.
---
header:
  seq: 0
  stamp:
    secs: 1282714102
    nsecs: 274102597
  frame_id: ''
reason: Manually triggered :
actuator_info:
  name: srh_ffj4
  slow_motor_current_limit: 0.16
  quick_motor_current_limit: 0.34
  duty_limit: 768.0
  max_duty: 1023.0
samples:
  -
    commanded_effort: 1.01063560013
    slow_effort_limit: 1.0
    quick_effort_limit: 1.0
    motor_current: 0.0
    motor_supply_voltage: 24.1290322581
    hbridge_duty: 768.0
    temperature: 41.62109375
reason
The reason field is provides some information as to why motor trace was published.
reason: Manually triggered :
In this case Manually triggered : indicates that the motor trace was published because of an outside request. The outside request was made by using publish_trace.py in previous setop.
If publishing was triggered by a motor overheating, the reason would be something like:
Reason : Over temperature
actuator_info
TODO
samples
The samples field is actually an array of single sample of data from a cycle of the realtime control loop of pr2_etherCAT. The control loop runs at about 1kHz so there should be 1000 samples for 1-second of data.
Using srh_plot.py
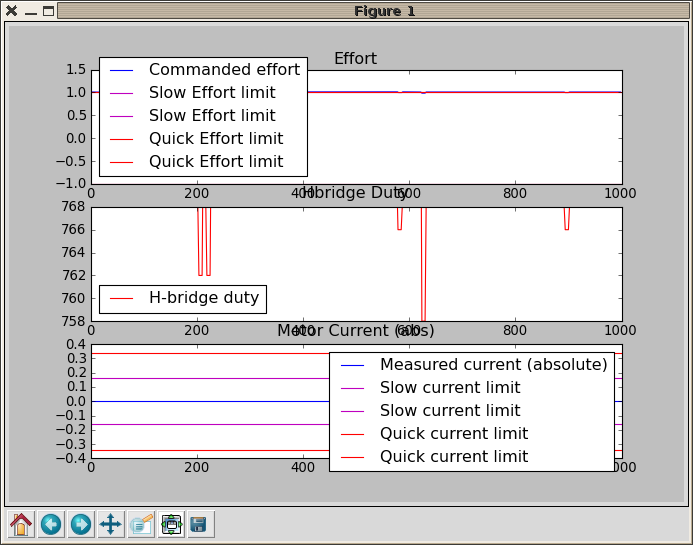
Unfortunately rxplot cannot plot the data in the motor trace. Instead the srh_plot.py script will make a few plots of some of the information in the samples array of the motor trace message.
Run:
rosrun srh_mtrace srh_plot.py srh_ffj4
You will probably have a few different graphs pop up. The first graph may look something like: <br> 
The script will also output a summary of the information in the window it was run from:
subscribing to topic /motor_trace/srh_ffj4
Got data for actuator srh_ffj4 with 1000 samples
Reason : Manually triggered :
Data was published : Tue, Aug 24, 10:28 PM -- 26 minutes and 22.776842446 seconds ago
Timestamp seconds = 1282714102
Recording motor trace
Like any other topic, the the motor trace message can be recorded into a bag file. Recording the motor trace data can be useful when creating a support ticket for some type of hardware error.
Record file named ffj4.bag. rosbag record will keep trying to record data until you push ctrl-C to stop it.
rosbag record -O ffj4 /motor_trace/srh_mmj4
Here's the the output should look like for the command.
 INFO] [1282717048.151197960]: Subscribing to /motor_trace/srh_mmj4
[ INFO] [1282717048.152301641]: Recording to ffj4.bag.
^C[ INFO] [1282717050.206710141]: Closing ffj4.bag.
Use rosbag info to make sure you captured a motor trace message:
rosbag info ffj4.bag
The output should be something like:
path:    ffj4.bag
version: 2.0
size:    4.0 KB


