Show EOL distros:
Package Summary
rqt_multiplot provides a GUI plugin for visualizing numeric values in multiple 2D plots using the Qwt plotting backend.
- Maintainer status: developed
- Maintainer: Ralf Kaestner <ralf.kaestner AT gmail DOT com>, Samuel Bachmann <samuel.bachmann AT gmail DOT com>
- Author: Ralf Kaestner
- License: GNU Lesser General Public License (LGPL)
- Source: git https://github.com/anybotics/rqt_multiplot_plugin.git (branch: indigo)
Package Summary
rqt_multiplot provides a GUI plugin for visualizing numeric values in multiple 2D plots using the Qwt plotting backend.
- Maintainer status: developed
- Maintainer: Ralf Kaestner <ralf.kaestner AT gmail DOT com>, Samuel Bachmann <samuel.bachmann AT gmail DOT com>
- Author: Ralf Kaestner
- License: GNU Lesser General Public License (LGPL)
- Source: git https://github.com/ethz-asl/rqt_multiplot_plugin.git (branch: master)
Package Summary
rqt_multiplot provides a GUI plugin for visualizing numeric values in multiple 2D plots using the Qwt plotting backend.
- Maintainer status: developed
- Maintainer: Samuel Bachmann <sbachmann AT anybotics DOT com>, Philipp Leemann <pleemann AT anybotics DOT com>
- Author: Ralf Kaestner <ralf.kaestner AT gmail DOT com>
- License: GNU Lesser General Public License (LGPL)
- Source: git https://github.com/anybotics/rqt_multiplot_plugin.git (branch: master)
Package Summary
rqt_multiplot provides a GUI plugin for visualizing numeric values in multiple 2D plots using the Qwt plotting backend.
- Maintainer status: developed
- Maintainer: Ralf Kaestner <ralf.kaestner AT gmail DOT com>, Samuel Bachmann <sbachmann AT anybotics DOT com>
- Author: Ralf Kaestner
- License: GNU Lesser General Public License (LGPL)
- Source: git https://github.com/anybotics/rqt_multiplot_plugin.git (branch: master)
Package Summary
rqt_multiplot provides a GUI plugin for visualizing numeric values in multiple 2D plots using the Qwt plotting backend.
- Maintainer status: developed
- Maintainer: Samuel Bachmann <sbachmann AT anybotics DOT com>, Philipp Leemann <pleemann AT anybotics DOT com>
- Author: Ralf Kaestner <ralf.kaestner AT gmail DOT com>
- License: GNU Lesser General Public License (LGPL)
- Source: git https://github.com/anybotics/rqt_multiplot_plugin.git (branch: master)
Package Summary
rqt_multiplot provides a GUI plugin for visualizing numeric values in multiple 2D plots using the Qwt plotting backend.
- Maintainer status: maintained
- Maintainer: Samuel Bachmann <sbachmann AT anybotics DOT com>, Philipp Leemann <pleemann AT anybotics DOT com>
- Author: Ralf Kaestner <ralf.kaestner AT gmail DOT com>
- License: GNU Lesser General Public License (LGPL)
This project provides a C++ GUI plugin for visualizing numeric values in multiple 2D plots using the Qwt plotting backend.
Features:
- Curve colors are changeable
- x-Axis can be anything, not just time
- Multiple plots in one GUI
- Legend
- Export plot to image or text file
- Import bag file
- Run/pause plot individually
- Link x-axis
- Store plot configuration
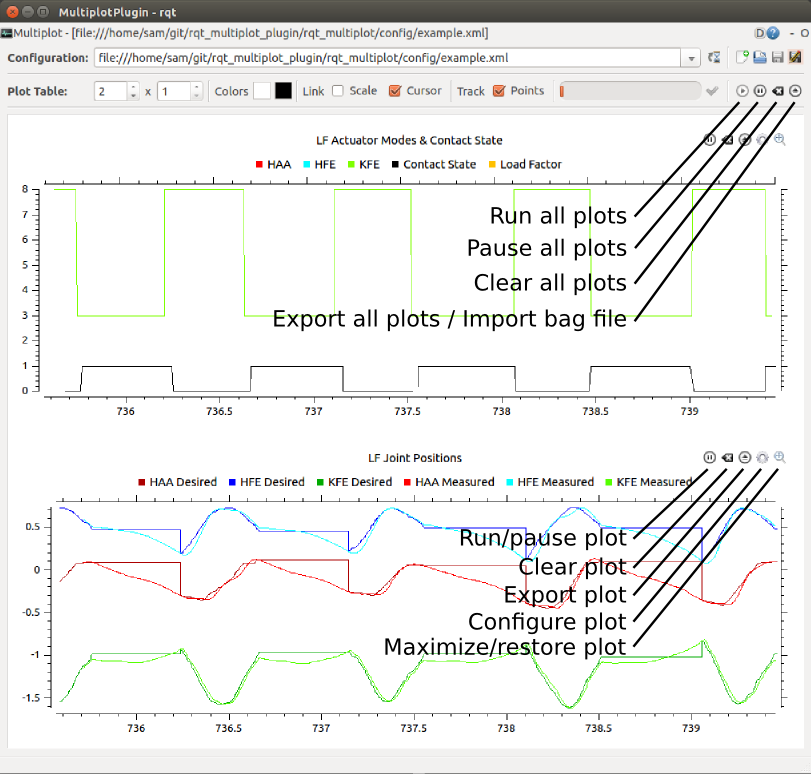
Example Pictures

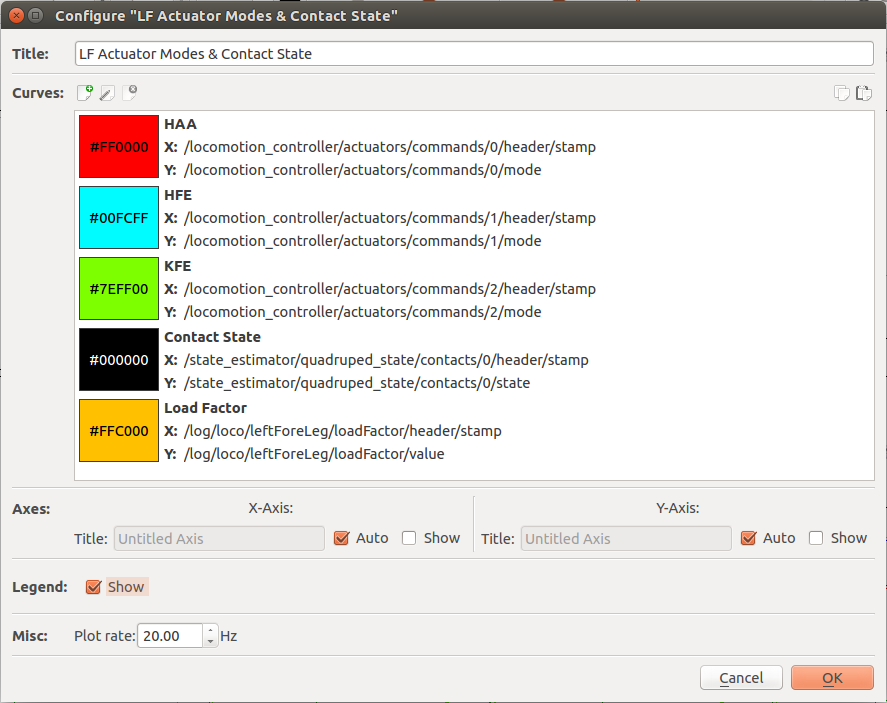
Configure Plot

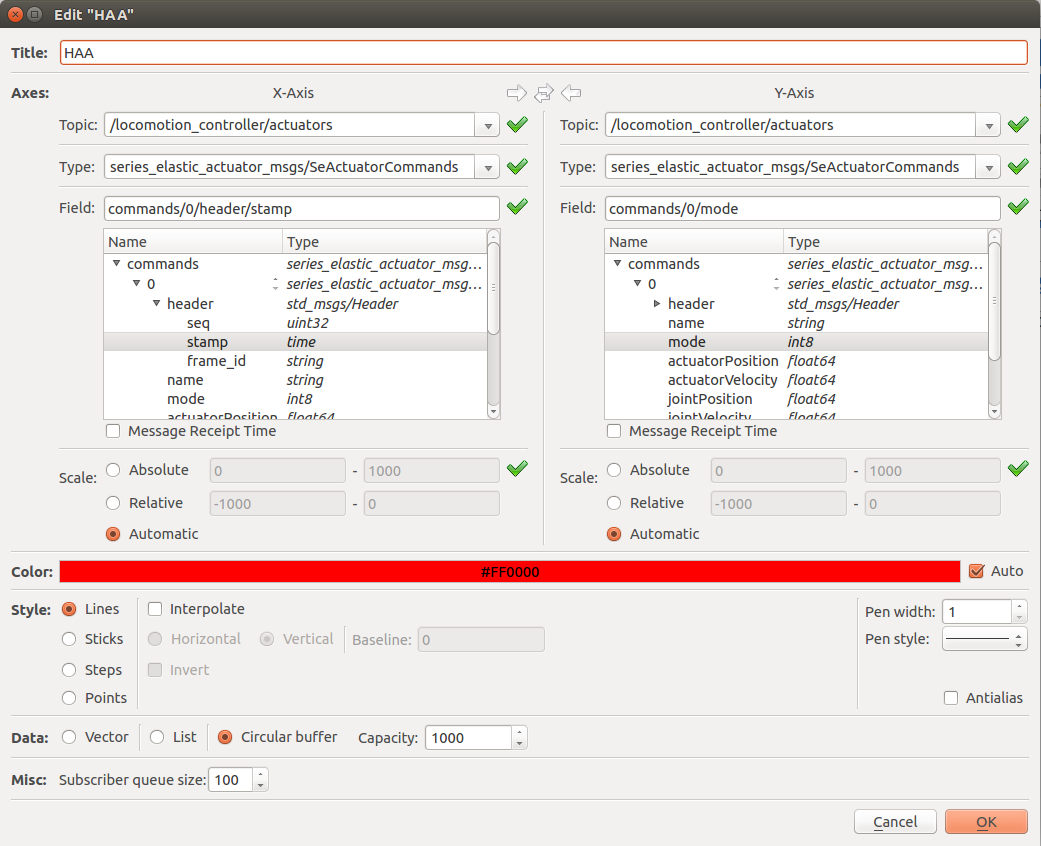
Edit Curve

Reporting bugs
https://github.com/ethz-asl/rqt_multiplot_plugin/issues


