Package Summary
skin_dashboard
- Author: Joerg Wagner
- License: BSD
- Repository: bosch-ros-pkg
- Source: svn http://svn.code.sf.net/p/bosch-ros-pkg/code/tags/stacks/bosch_skin/bosch_skin-0.3.0
The Dashboard
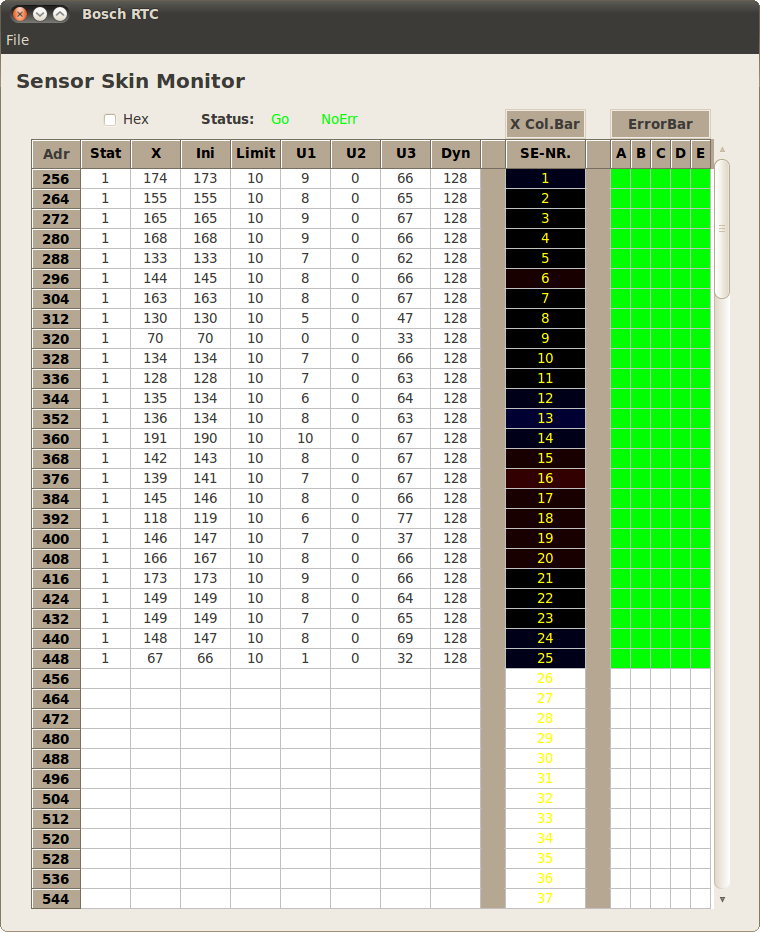
The Skin Dashboard shows the skin's current status. For each sensor patch of the skin one line is displayed in the grid. The important colums of the grid are "Sensor Number", "X" and "Ini". All other columns including the "Error Bar" are for debugging purposes only.
The difference between the values "X" and "Ini" indicates whether an object is close to the specific patch. If the difference is zero or small no object is in proximity, the greater the difference gets the closer an object is. This is visualized by the "X Color Bar": The "X Color Bar" displays whether the patch is clear (black color) or an object is in front of the specific patch (red or blue).
In the left picture all patches are clear and thus the "X Color Bar" is completely black. In the right image an object is very close to the sensors 14, 15 (red) and in proximity of sensor 18, 23 and 24 (light red).
In addition to the status of each individual patch the overall status of the system is displayed by "Error" or "NoError" and "Go" or "NoGo".
Nodes
skin_dashboard
The skin_dashboard node provides a graphical user interface which displays the skin's status graphically.Subscribed Topics
~<name>/skin_data (skin_driver/skin_meas)- Raw skin measurement with configuration data


