| Note: This tutorial assumes that you have completed the previous tutorials: Set up and test Optimization. |
| |
Inspect optimization feedback
Description: In this tutorial you will learn how to inspect feedback of optimized trajectories; an example is presented which visualizes the velocity profile of the currently selected trajectory.Keywords: Trajectory Optimization Local Planner Navigation Velocity
Tutorial Level: INTERMEDIATE
Next Tutorial: Configure and run Robot Navigation
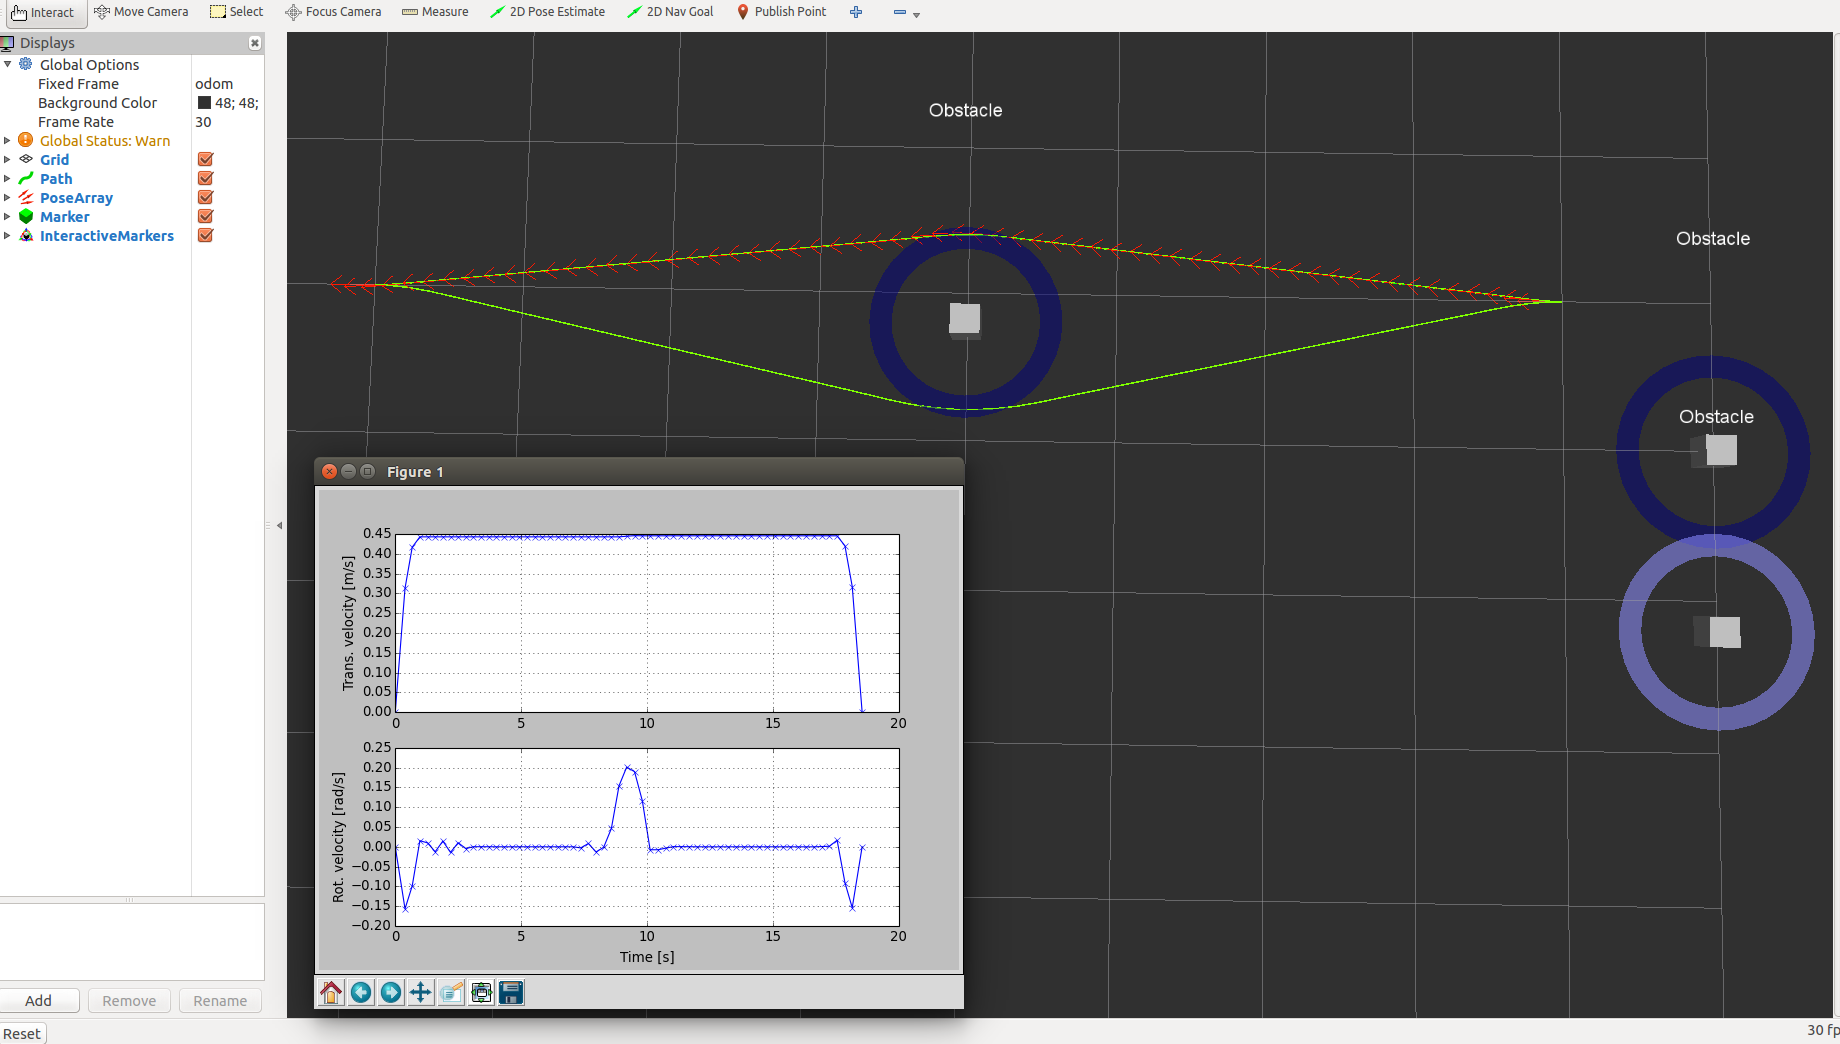
In the previous example you learned how to test the optimization, how to tune the parameters and how to visualize the resulting trajectories in rviz. However, the trajectories visualized in rviz do not contain any temporal information, only their spatial states are shown. For further parameter tuning or evaluation purposes it might be of interest to gain access to the underlying optimization states (involving the temporal ones). Thus, teb_local_planner provides a feedback message teb_local_planner/FeedbackMsg containing all internal states and some inferred variables (like the velocity profile). Note, the acceleration profile is empty currently. Furthermore, the message contains all alternative trajectories that are found in distinctive topologies. The currently selected trajectory index is stored in variable selected_trajectory_idx.
The feedback topic (see planner API) can be subscribed by any node (e.g. to export data to file, write some custom visualization, ...).
Note, the sending the feedback message is turned off by default in order to reduce the computational burden slighly. It can be enabled by either setting the rosparam ~/publish_feedback to true or by invoking rqt_reconfigure.
Visualize velocity profile
In the following, a small python script is presented that subscribes to the test_optim_node which was introduced in the previous tutorial. The script depends on *pypose* in order to create plots. Only the velocity profile of the currently selected trajectory is shown.
   1 #!/usr/bin/env python
   2
   3 import rospy, math
   4 from teb_local_planner.msg import FeedbackMsg, TrajectoryMsg, TrajectoryPointMsg
   5 from geometry_msgs.msg import PolygonStamped, Point32
   6 import numpy as np
   7 import matplotlib.pyplot as plotter
   8
   9 def feedback_callback(data):
  10   global trajectory
  11
  12   if not data.trajectories: # empty
  13     trajectory = []
  14     return
  15   trajectory = data.trajectories[data.selected_trajectory_idx].trajectory
  16
  17
  18 def plot_velocity_profile(fig, ax_v, ax_omega, t, v, omega):
  19   ax_v.cla()
  20   ax_v.grid()
  21   ax_v.set_ylabel('Trans. velocity [m/s]')
  22   ax_v.plot(t, v, '-bx')
  23   ax_omega.cla()
  24   ax_omega.grid()
  25   ax_omega.set_ylabel('Rot. velocity [rad/s]')
  26   ax_omega.set_xlabel('Time [s]')
  27   ax_omega.plot(t, omega, '-bx')
  28   fig.canvas.draw()
  29
  30
  31
  32 def velocity_plotter():
  33   global trajectory
  34   rospy.init_node("visualize_velocity_profile", anonymous=True)
  35
  36   topic_name = "/test_optim_node/teb_feedback" # define feedback topic here!
  37   rospy.Subscriber(topic_name, FeedbackMsg, feedback_callback, queue_size = 1)
  38
  39   rospy.loginfo("Visualizing velocity profile published on '%s'.",topic_name)
  40   rospy.loginfo("Make sure to enable rosparam 'publish_feedback' in the teb_local_planner.")
  41
  42   # two subplots sharing the same t axis
  43   fig, (ax_v, ax_omega) = plotter.subplots(2, sharex=True)
  44   plotter.ion()
  45   plotter.show()
  46
  47
  48   r = rospy.Rate(2) # define rate here
  49   while not rospy.is_shutdown():
  50
  51     t = []
  52     v = []
  53     omega = []
  54
  55     for point in trajectory:
  56       t.append(point.time_from_start.to_sec())
  57       v.append(point.velocity.linear.x)
  58       omega.append(point.velocity.angular.z)
  59
  60     plot_velocity_profile(fig, ax_v, ax_omega, np.asarray(t), np.asarray(v), np.asarray(omega))
  61
  62     r.sleep()
  63
  64 if __name__ == '__main__':
  65   try:
  66     trajectory = []
  67     velocity_plotter()
  68   except rospy.ROSInterruptException:
  69     pass
The script is already included in the teb_local_planner_tutorials package as visualize_velocity_profile.py.
Assuming the roscore is already running, visualize the velocity as follows:
rosparam set /test_optim_node/publish_feedback true # or use rqt_reconfigure later
roslaunch teb_local_planner test_optim_node.launch
rosrun teb_local_planner_tutorials visualize_velocity_profile.py # or call your own script here
You should be able to inspect the velocity profile now during runtime as depicted in the following figure:


