| Note: This tutorial assumes that you have completed the previous tutorials: Visualize prior execution. |
| |
Interactive execution and visualization
Description: In this tutorial you will learn the basics of incremental, interactive execution and visualization of trex.Keywords: trex, trexmonitor, trexrun, interactive, visualization
Tutorial Level: BEGINNER
Next Tutorial: Introducing agent actions
Contents
Start T-REX for incremental execution
We want to run the executive under tight user control. To do this, we simply start [Tools#trexrun trexrun] with console mode enabled. For maximum speed of execution (faster than real time), we will also use the hyper clock. First start ros with suitable parameters:
roscd demo
roslaunch test/demo/demo.test
Then to start the executive in console mode, type the following in a new terminal:
roscd demo
trexrun --console --hyper
You should see a console open up with the following output:
[ INFO] 1256922335.220563000: Starting signal handler
[ INFO] 1256922335.246109000: Registering demo Schema
[ INFO] 1256922335.253864000: Registering demo Schema
[ INFO] 1256922335.262132000: Executive created.

[ INFO] 1256922335.262348000: Finished creating executive
[ INFO] 1256922335.262475000: Running the executive in interactive mode.

At the start of tick 0, H for help.
>
This indicates the executive has been successfully loaded, but the clock has not yet advanced beyond the initial tick value of 1. Notice the command prompt. To display a help menu:
>h
Which will display the following help menu:
Interactive mode.
Options:
 Q :- Quit
 N :- Next
 G :- Goto <tick> e.g. g100
 R :- Reload Debug.cfg
 + :- Enable pattern e.g. '+Agent'
 - :- Disable pattern e.g. '-Agent'
 ! :- Disable all debug messages
 P :- Execute a db dump at the current tick
 PS :- Start dumping the db at each tick
 PE :- Stop dumping the db at each tick
 H :- Help
Enable verbose visualization output
In this tutorial we will use additional features of trexmonitor. To support these features, we need to enable certain settings in the executive that are not set by default because they generate a lot of data which can hamper performance for large systems. To enable verbose output we enable a trex debug flag as follows:
>+trex:monitor:verbose
Which will produce the confirmation message:
Enable pattern: trex:monitor:verbose
>
Start up trexmonitor
To restart trexmonitor, open up a shell and:
roscd demo
trexmonitor --dir logs/latest
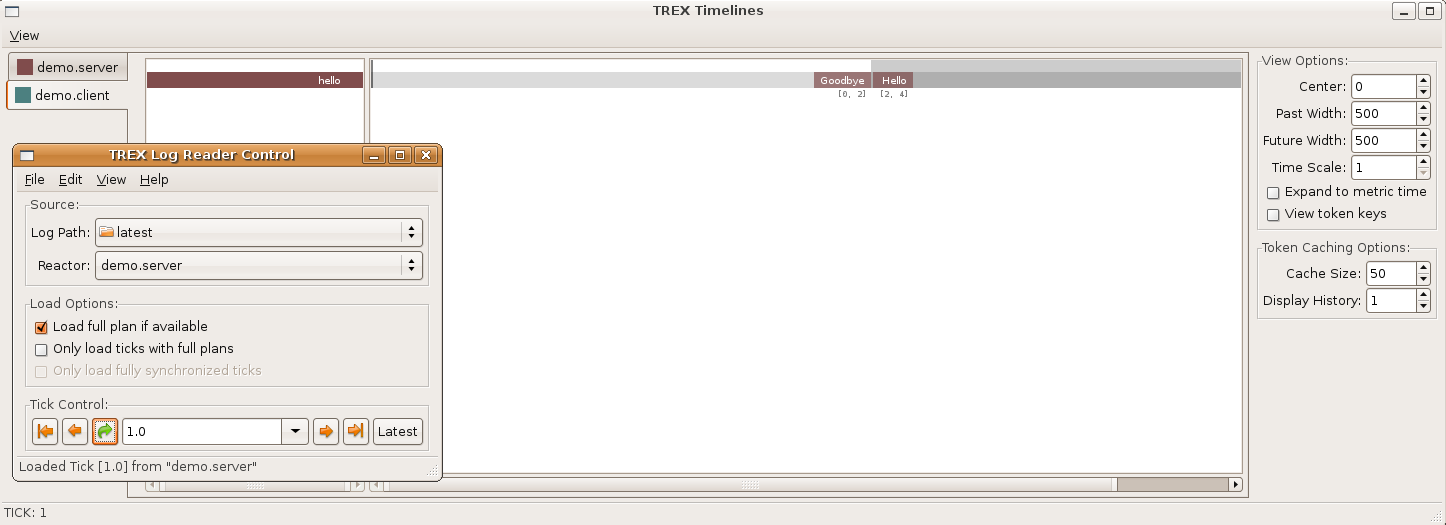
You should see the TREX Log Reader Control window front and center as shown below:
[trexmonitor.interactive_tick_0.png]
Observe that there are no reactors in the background Timeline window, and no ticks are displayed. This is because no visualization data has been logged from the executive yet.
Arrange windows so that the Log Reader Control, Timeline, and executive console are all visible together.
Set up trexmonitor to track execution
In this example we will configure TrexMonitor trexmonitor to operate in a tracking mode where it updates automatically as the executive clock advances. The 'execution frontier' is the 'latest' tick of execution:
select the TREX Log Reader Control window
click on the 'latest' tick control button
You can always switch back and forth between tracking the latest state and moving through specific points in execution history.
Now we will advance to the next tick and observe the updated state in the Timeline window.
switch to the trex console
Advance to the next tick:
>n
This will report:
At the start of tick 1, H for help.
>
We now want to switch our attention to the client reactor window. Observe that the plan has not been created yet. The visible state remains tick 0 since the executive does not log data for visualization until the end of a tick. Now advance again through the console:
>n
You will see an update to the client reactor window as shown below:

Visualize the token properties
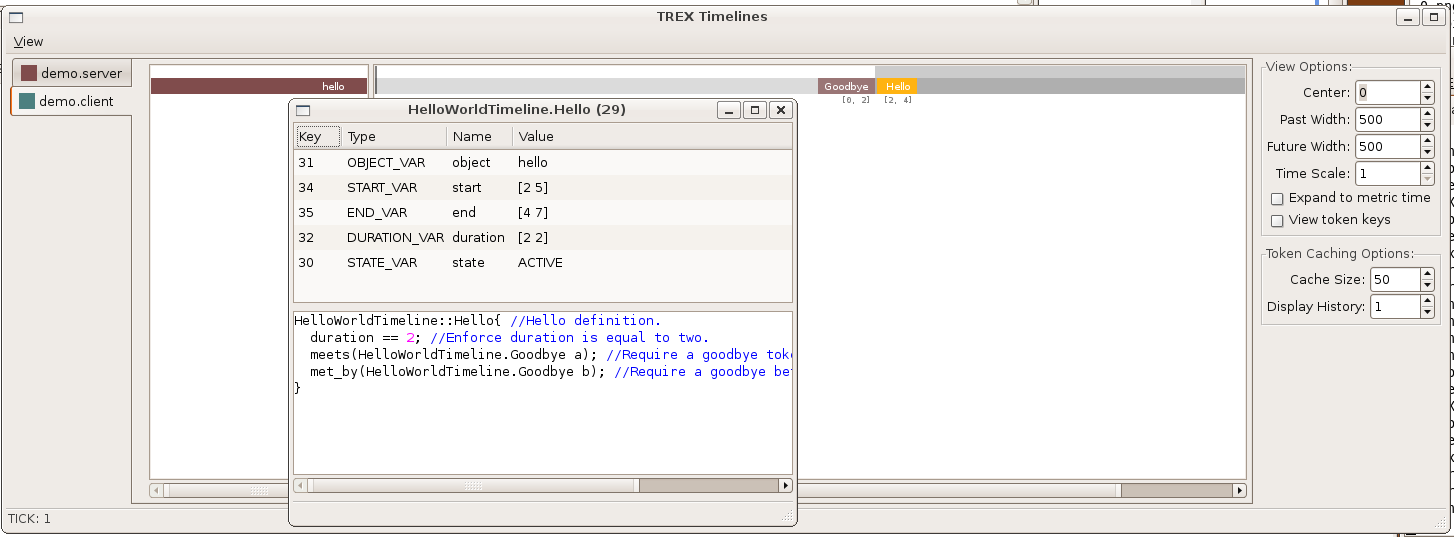
One of the things we would like to do is inspect some details about the token. trexmonitor has a *token properties* window available. To open it:
select the 'Hello' token in the Timeline window.
right-mouse click
select 'View token properties'
This will pop up the following window which illustrates all parameters associated with the token, and its model rules.

Visualize the token network
We can visualize the relationship between tokens in this reactor:
select the 'Hello' token in the Timeline window.
right-mouse click
select 'Highlight in token network'
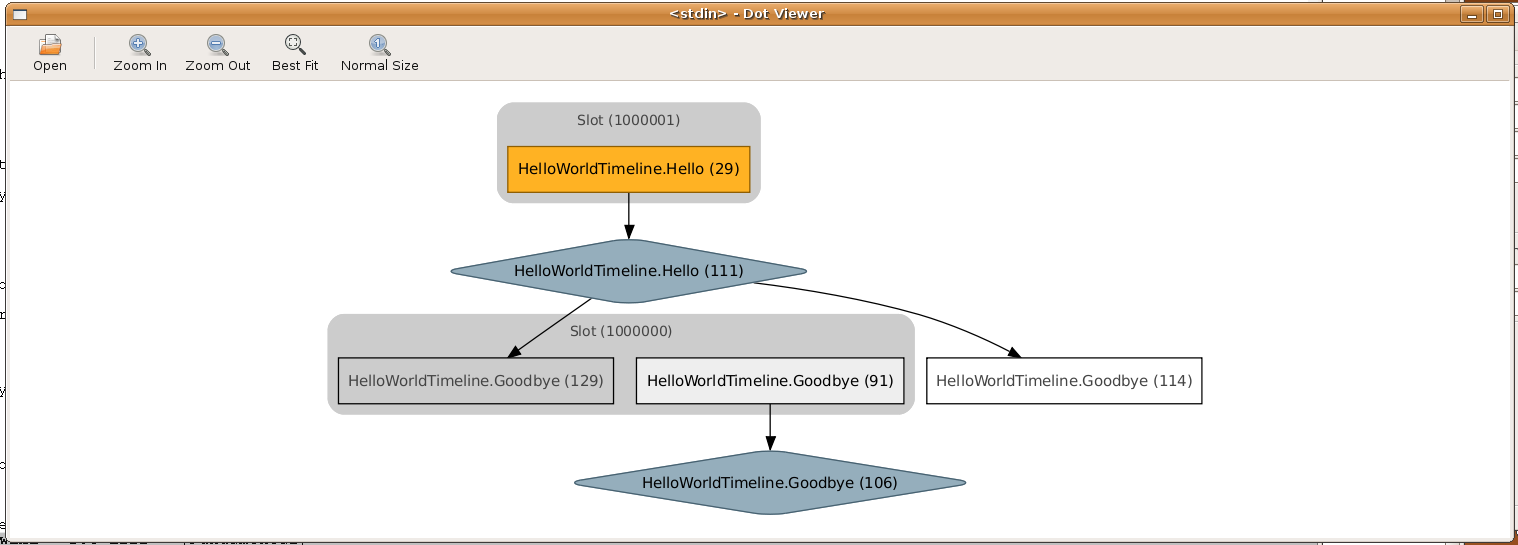
The token network viewer will now appear showing tokens organized in a graph, indicating dependencies:

At the root of the graph is the active token selected. It is contained in a slot of the timeline. More than one token can be in a slot. For example, tokens 129 and 91 share slot 1000000. Token 129 is merged onto token 91.
Any node in the graph can be inspected by clicking on it, which will bring up the token properties window again. Clickable entities are either tokens (rectangles) or rules (parallelograms). The rules govern the semantics of dependencies between tokens. For example, the rule (node 111):
HelloWorldTimeline::Hello{ //Hello definition.
  duration == 2; //Enforce duration is equal to two.
  meets(HelloWorldTimeline.Goodbye a); //Require a goodbye token after this hello token.
  met_by(HelloWorldTimeline.Goodbye b); //Require a goodbye before this hello token.
}
creates connections to 2 different sub-goal tokens indicating required successor and predecessor states.
Run to completion
Switch to the server reactor in the Timeline window. We can now run the executive one step at a time to completion (it is a short example), and observe the state of execution as you go:
> n
At the start of tick 3, H for help.
> n
At the start of tick 4, H for help.
> n
At the start of tick 5, H for help.
> n
At the start of tick 6, H for help.
> n
At the start of tick 7, H for help.
> n
At the start of tick 8, H for help.
> n
At the start of tick 9, H for help.
> n
At the start of tick 10, H for help.
>
When you are done, simply type Q in the trex console to exit the console.


