| Note: This tutorial assumes that you have completed the previous tutorials: trex/Tutorials/Using the test harness. |
| |
Visualize prior execution
Description: In this tutorial you will learn the basics of using the trexmonitor tool to visualize executionKeywords: trexmonitor, trex, visualization
Tutorial Level: BEGINNER
Next Tutorial: Interactive execution and visualization
Contents
Starting the trexmonitor
By default, the executive created in the Create Project tutorial is configured to log information suitable for visualization using the trexmonitor. Since you will already have run the demo test case, the log files are in place to visualize the executions you have already made. To see this:
roscd demo
trexmonitor --dir logs/latest
This will launch the trexmonitor application which includes multiple windows.
The Log Reader Control Window
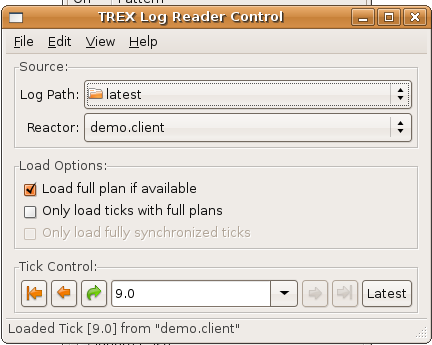
The first window of interest is the TREX Log Reader Control shown below: 
This window is used to dictate where execution log data is sourced from. We started the execution monitor to point to the logs/latest subdirectory of the demo package. When first launched, the reader is at the last tick of execution. Tick controllers are located at the bottom of this window, permitting:
- Skipping to the beginning of execution
- Skipping backwards 1 tick
- Advancing to a specific tick
- Skipping forward 1 tick
- Skipping to the current point of execution
- Keeping up with the latest point of execution
The Timelines Window
To reveal a second window titled 'TREX Timelines':
select the TREX Log Reader Control window
drag it out of the way
}}

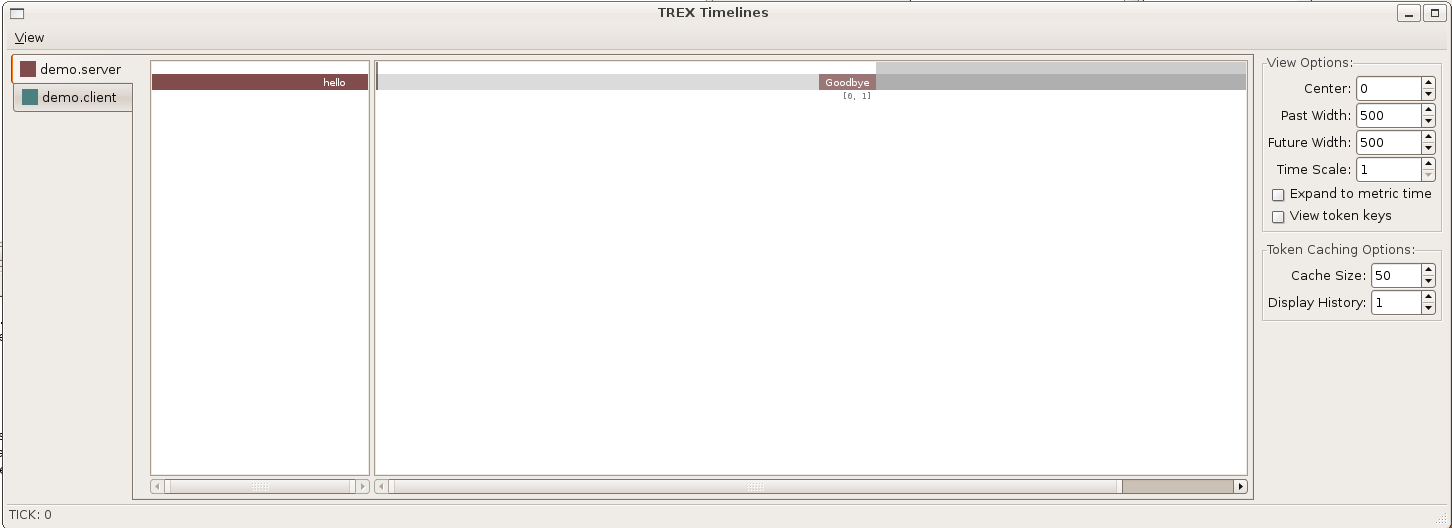
Revealing the 'TREX Timelines' window as shown below:

{{attachment:trex/Tutorials/Interactive%20execution%20and%20visualization/trexmonitor.timelines.png}}

This window shows all reactors in the executive for which we are logging timeline data. In the demo project, we have 2 such reactors, a client and a server. Notice that the *demo.server* reactor is selected (indicated in the tabbed side-bars).

To return to the initial state (tick 0):
{{{
select the TREX Log Reader Control window
click on the left-most tick control icon
Observe that the tick value becomes 0.0. Both the client and server reactors have a single *hello* timeline. The color of the timeline is determined by the color of the reactor that _owns_ that timeline. Clearly, the server reactor owns this timeline as is consistent with the nddl input shown earlier. The earliest end time is shown for the initial value (it is 1 in this case).

Visualize the plan
The demo project is trivial. A single goal to say Hello, which is planned immediately and dispatched at tick 1. To see the state where the client has a plan and the server does not:
select the TREX Log Reader Control window
Advance to tick 1 using the tick control right-arrow in the TREX Log Reader Control.
Select the demo.client reactor in the TREX Timelines window.
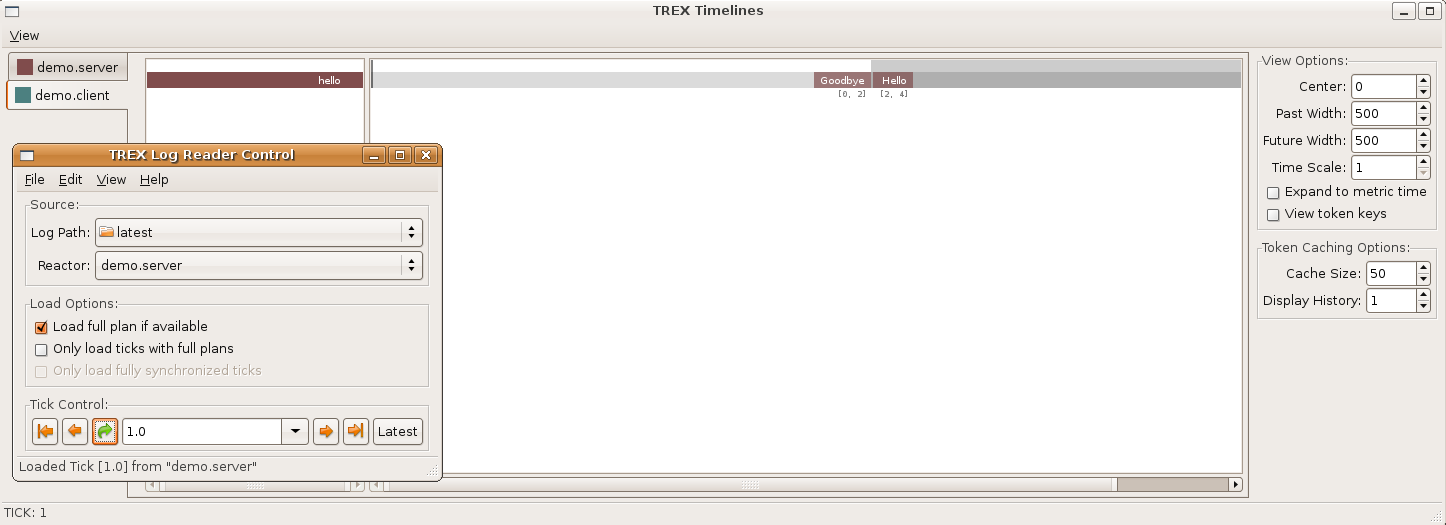
The expected result is shown below:

Notice that the timeline now includes an additional token (the goal) which has not yet been started. To see the state of the server:
Select the demo.server reactor in the TREX Timeline window
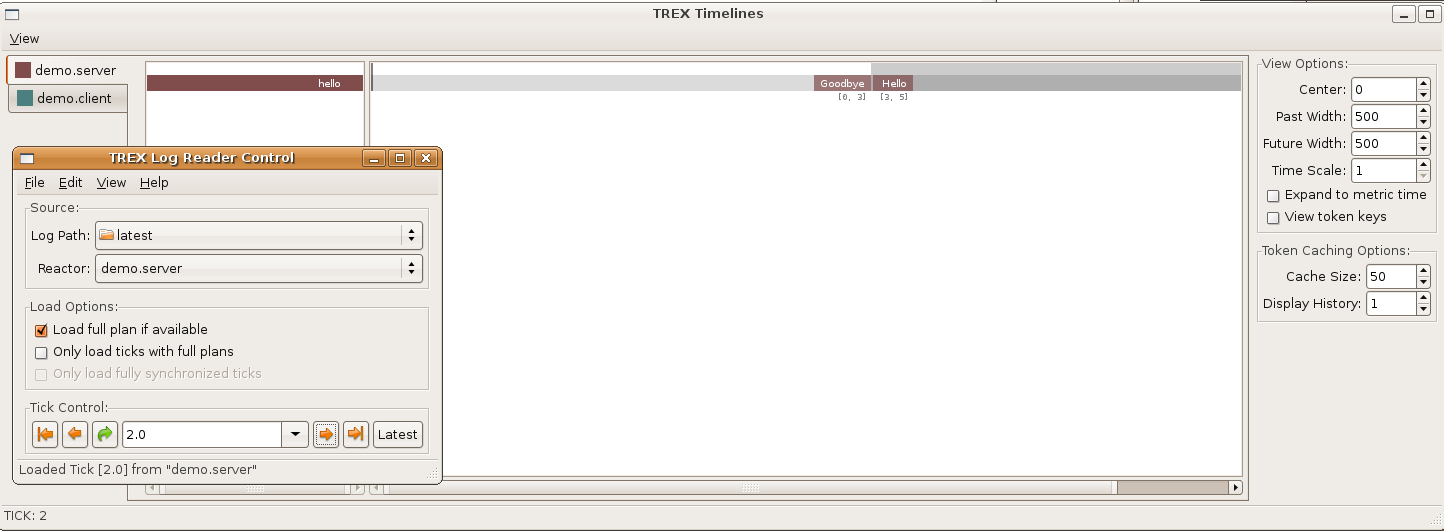
Observe that there is still only a single token indicating the new value has not been planned yet. By tick 2 that has been rectified. To see that:
Advance to tick 2 using the tick control right-arrow in the TREX Log Reader Control.

Finally, close all windows by:
selecting the TREX Log Reader Control window
clicking on the top-right X icon


