| Note: This tutorial assumes that you have completed the previous tutorials: Running the YRL. |
| |
Viewing LiDAR point clouds with RViz
Description: Viewing LiDAR point clouds with RVizKeywords: RViz, pointcloud
Tutorial Level: BEGINNER
Contents
Tutorial Description
This tutorial describes how to visualize the point clouds produced by the LiDARs of Yujin Robot's YRL series using RViz.
Visualizing point clouds - the fast and convenient way
The driver comes with a "roslauncher" enabling you to start up everything needed for visualizing point clouds conveniently with a single command.
$ source /opt/ros/melodic/setup.bash
$ roslaunch yujin_yrl_package driver_rviz.launch --screen
Specifically the launcher starts the following: * The driver as a ROS node * RViz as ROS node provided with a config file to set up the needed view automatically
For those interested in the details, you find below a step-by-step description for starting up the above nodes and applying the appropriate RViz settings manually.
Starting ROS core, YRL driver and RViz
Analog to the previous tutorial, we need three terminals to run all required applications.
In the first terminal, source your ROS environment and start the ROS core.
$ source /opt/ros/melodic/setup.bash
$ roscore
In a second terminal, source your ROS environment making sure that it includes the workspace containing the Yujin YRL package and run the driver. For example:
$ source /ros/catkin_ws/devel/setup.bash
$ rosrun yujin_yrl_package yrl_pub
In the third terminal, source your ROS environment and start RViz.
$ source /ros/catkin_ws/devel/setup.bash
$ rosrun rviz rviz
Visualizing the point clouds
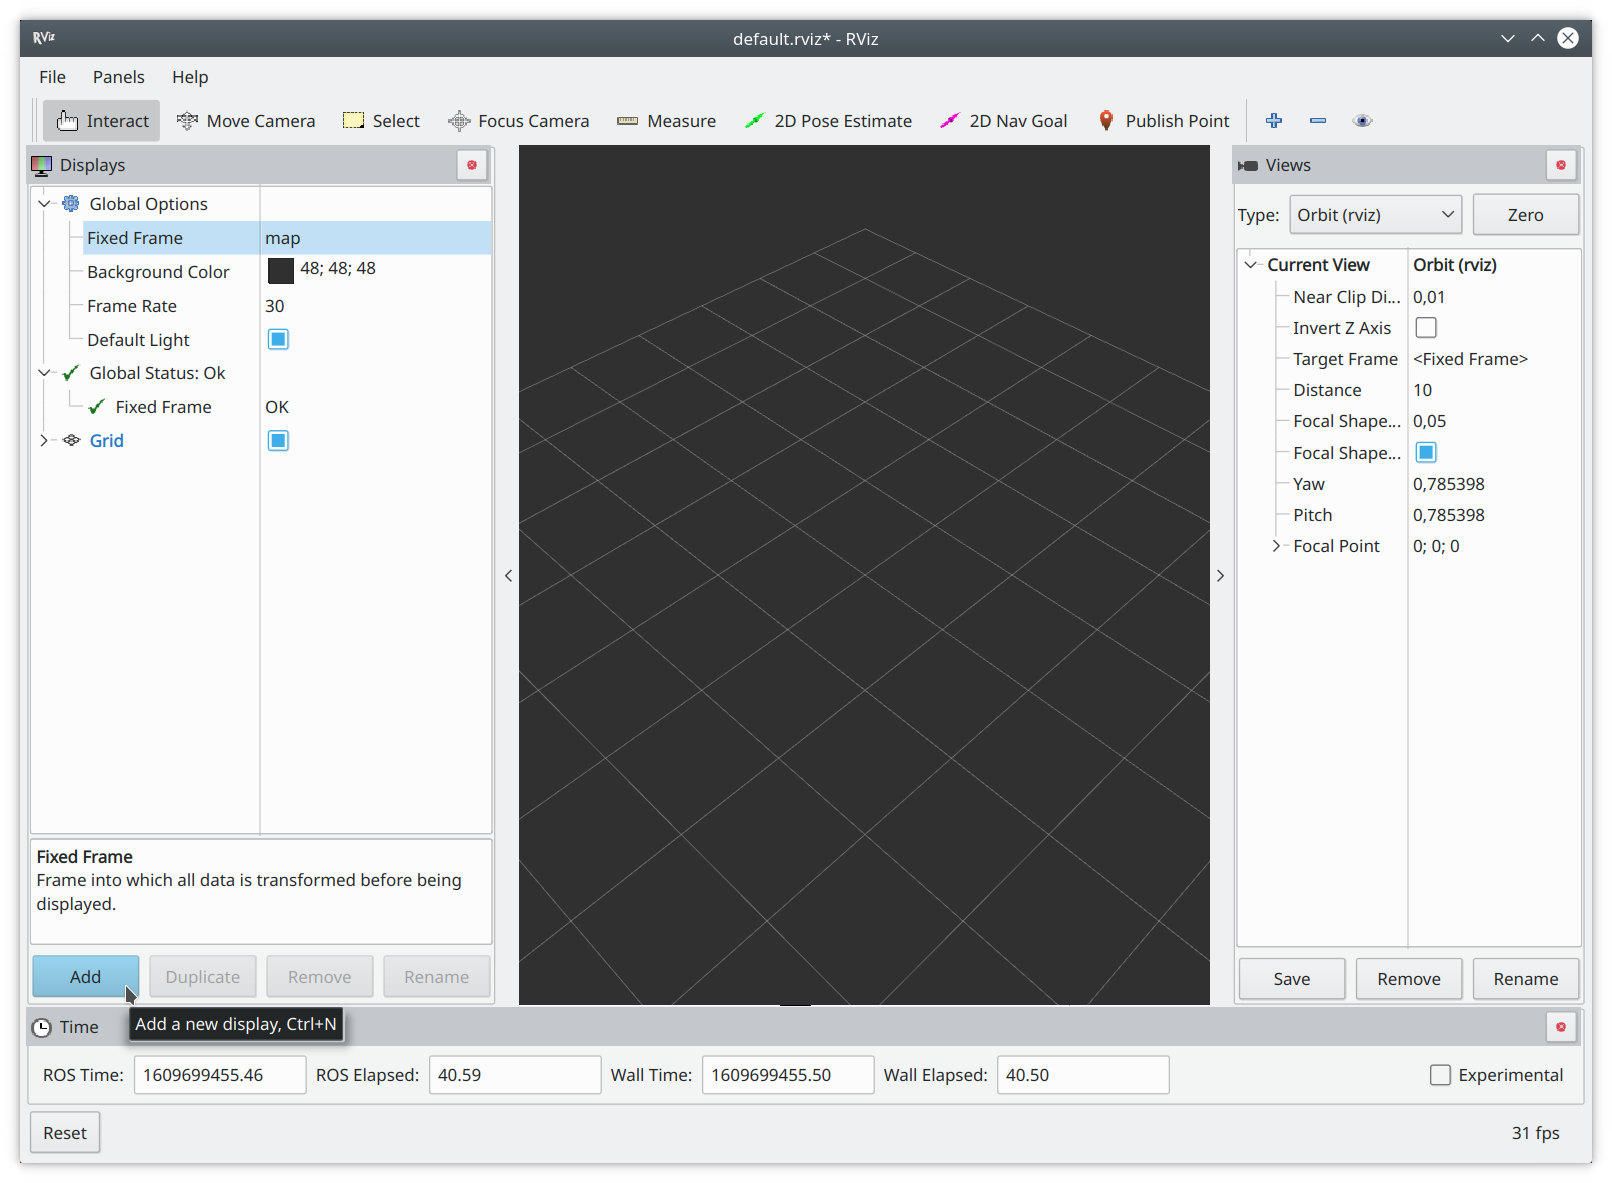
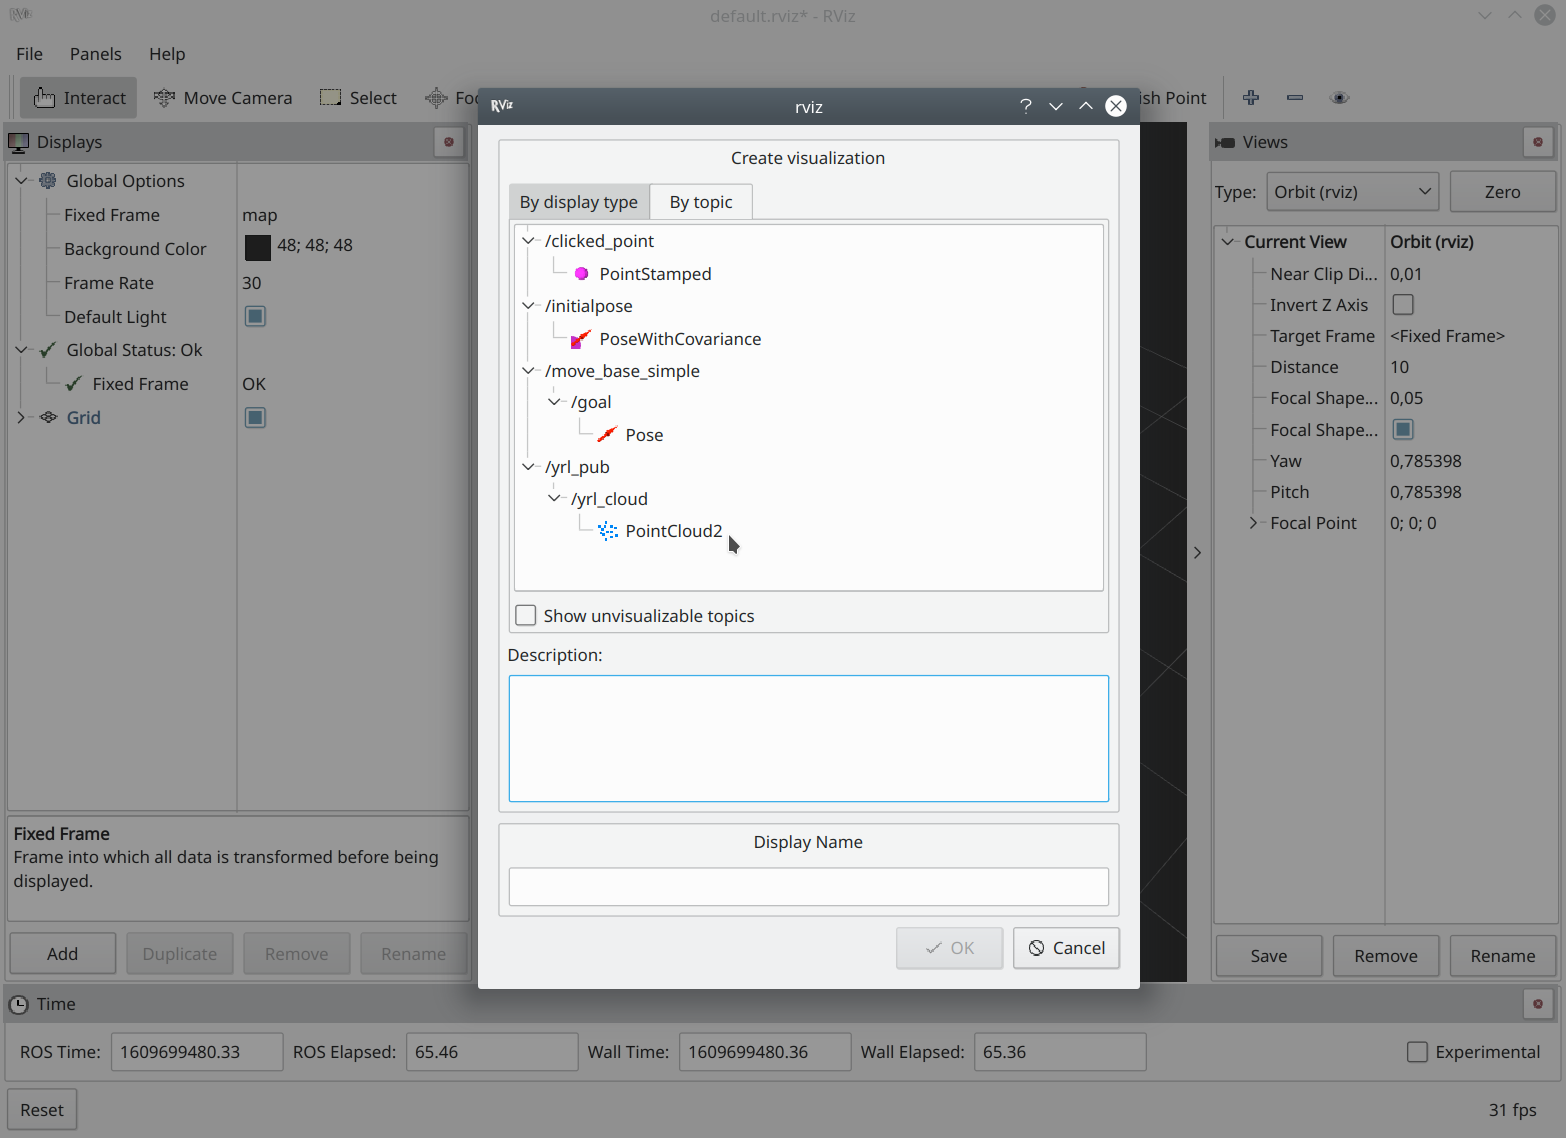
First, a new display for visualizing the messages published in the sensor_msgs/PointCloud2 format is needed.

A fast way to add such is selecting the display by topic as shown below.

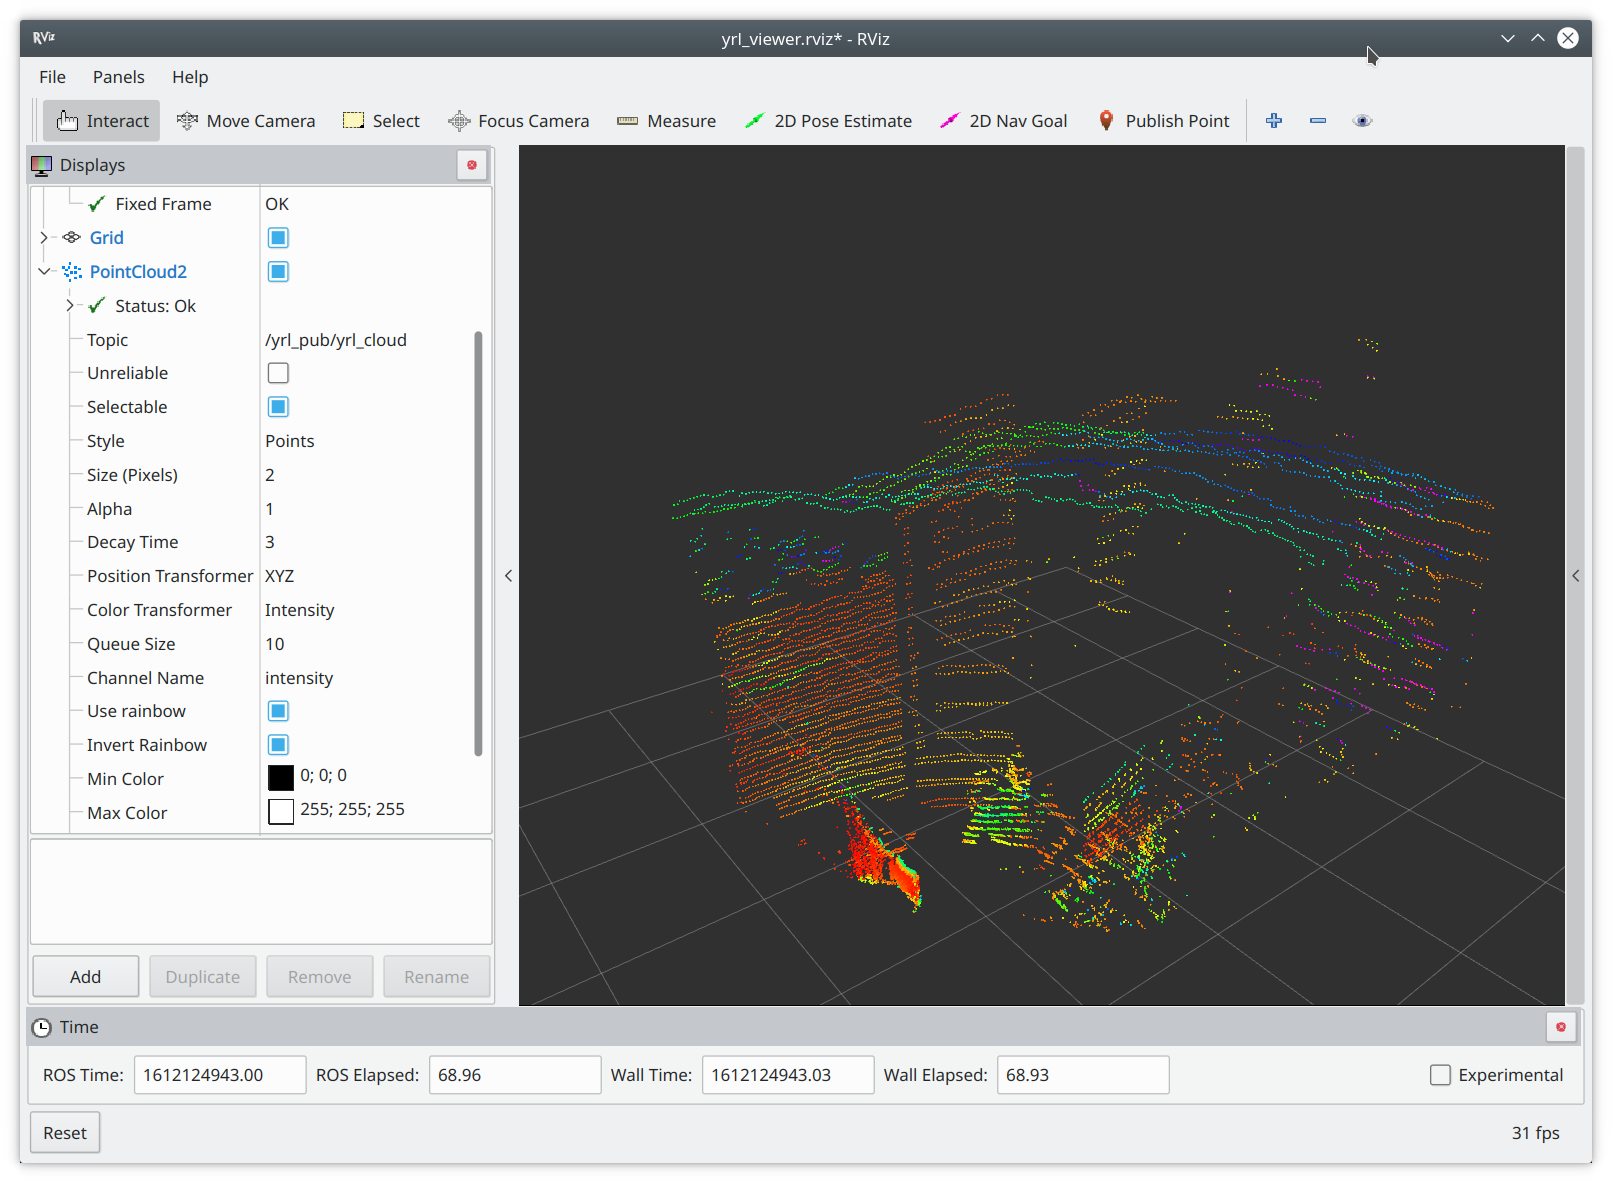
For creating a view similar to the one shown by the "Yujin LiDAR Viewer" apply the settings shown in the screenshot below, particularly: points instead of flat squares, a (pixel) size of 2, a decay time of 3, the color transformer "Intensity" and select "Invert Rainbow".


